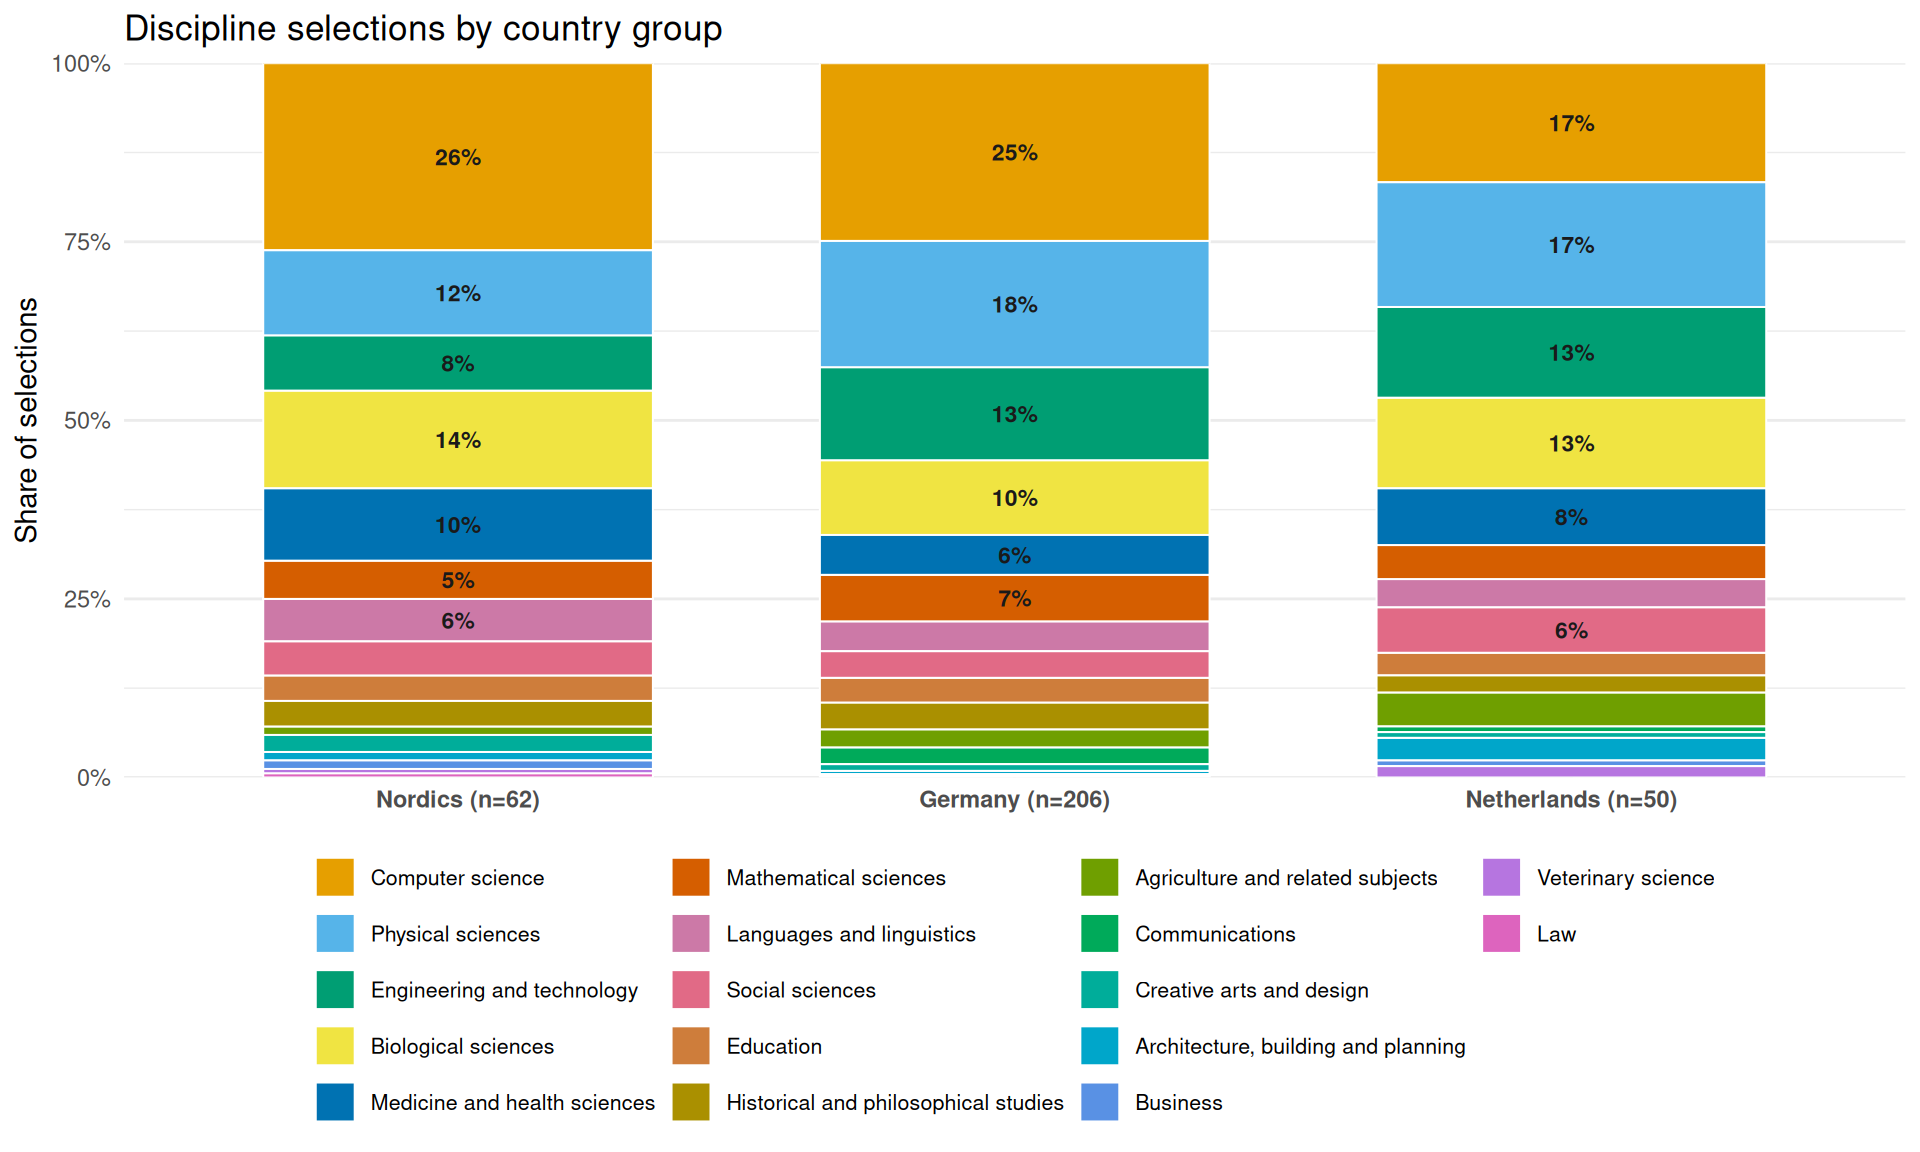
| Discipline (Nordics) | ||
| Total respondents: 62 | ||
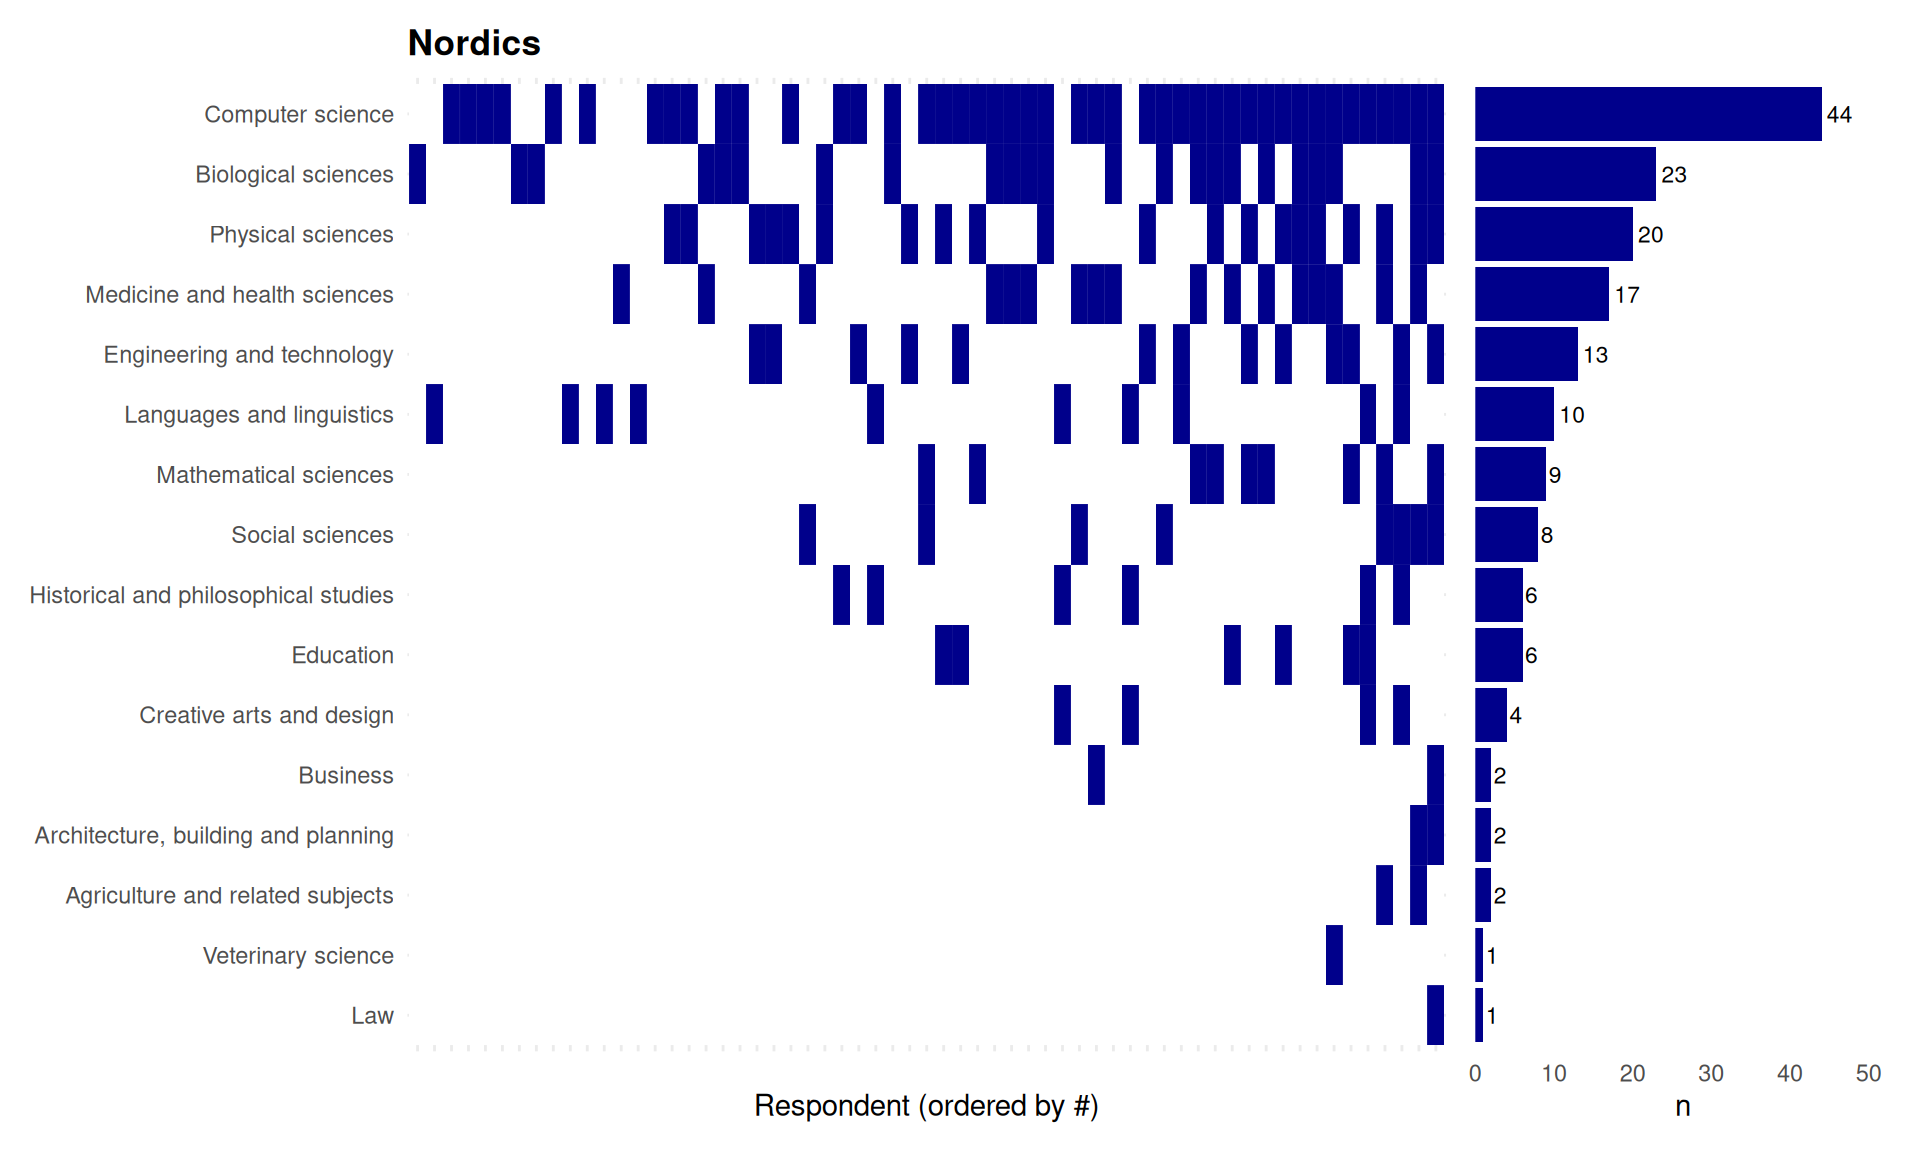
| Category | Respondents (n) | Percentage (%) |
|---|---|---|
| Computer science | 44 | 71.0% |
| Biological sciences | 23 | 37.1% |
| Physical sciences | 20 | 32.3% |
| Medicine and health sciences | 17 | 27.4% |
| Engineering and technology | 13 | 21.0% |
| Languages and linguistics | 10 | 16.1% |
| Mathematical sciences | 9 | 14.5% |
| Social sciences | 8 | 12.9% |
| Education | 6 | 9.7% |
| Historical and philosophical studies | 6 | 9.7% |
| Creative arts and design | 4 | 6.5% |
| Agriculture and related subjects | 2 | 3.2% |
| Architecture, building and planning | 2 | 3.2% |
| Business | 2 | 3.2% |
| Law | 1 | 1.6% |
| Veterinary science | 1 | 1.6% |
24 Please select the discipline(s) in which you work.
24.1 Nordics
24.1.1 Descriptive Statistics
24.1.2 Free-text responses
| Discipline (Nordics) [Others] | ||
| Response Category | Frequency (n) | Percentage (%) |
|---|---|---|
| Humanities and social sciences | 3 | 37.5% |
| Cross-cutting / research-wide | 2 | 25.0% |
| Computing, data and engineering | 1 | 12.5% |
| Life sciences and neuroscience | 1 | 12.5% |
| all | 1 | 12.5% |
The raw-to-category allocation table for this question is in Appendix B.
24.1.3 Statistics by age group
| Discipline by age group (Nordics) | ||||||||
| Total respondents with age reported: 61. Rows are ranked separately within each age group by respondent count. | ||||||||
Below 35 (n=20)
|
35-45 (n=27)
|
45+ (n=14)
|
||||||
|---|---|---|---|---|---|---|---|---|
| Category | Respondents (n) | Percentage (%) | Category | Respondents (n) | Percentage (%) | Category | Respondents (n) | Percentage (%) |
| Computer science | 15 | 75.0% | Computer science | 20 | 74.1% | Computer science | 8 | 61.5% |
| Biological sciences | 7 | 35.0% | Biological sciences | 13 | 48.1% | Physical sciences | 4 | 30.8% |
| Physical sciences | 7 | 35.0% | Medicine and health sciences | 11 | 40.7% | Engineering and technology | 3 | 23.1% |
| Engineering and technology | 5 | 25.0% | Physical sciences | 9 | 33.3% | Languages and linguistics | 3 | 23.1% |
| Medicine and health sciences | 3 | 15.0% | Social sciences | 7 | 25.9% | Biological sciences | 2 | 15.4% |
| Education | 2 | 10.0% | Engineering and technology | 5 | 18.5% | Historical and philosophical studies | 2 | 15.4% |
| Languages and linguistics | 2 | 10.0% | Languages and linguistics | 5 | 18.5% | Medicine and health sciences | 2 | 15.4% |
| Mathematical sciences | 2 | 10.0% | Mathematical sciences | 5 | 18.5% | Business | 1 | 7.7% |
| Agriculture and related subjects | 1 | 5.0% | Creative arts and design | 3 | 11.1% | Education | 1 | 7.7% |
| Architecture, building and planning | 1 | 5.0% | Education | 3 | 11.1% | Mathematical sciences | 1 | 7.7% |
| Creative arts and design | 1 | 5.0% | Historical and philosophical studies | 3 | 11.1% | |||
| Historical and philosophical studies | 1 | 5.0% | Agriculture and related subjects | 1 | 3.7% | |||
| Social sciences | 1 | 5.0% | Architecture, building and planning | 1 | 3.7% | |||
| Business | 1 | 3.7% | ||||||
| Law | 1 | 3.7% | ||||||
| Veterinary science | 1 | 3.7% | ||||||
24.2 Within Nordics
| Discipline selections within Nordics | ||
| Total respondents: 62. Percentages are within each country. | ||
| Category | Respondents (n) | Percentage (%) |
|---|---|---|
| Estonia (n=8) | ||
| Computer science | 8 | 100.0% |
| Biological sciences | 5 | 62.5% |
| Medicine and health sciences | 2 | 25.0% |
| Education | 1 | 12.5% |
| Iceland (n=1) | ||
| Biological sciences | 1 | 100.0% |
| Computer science | 1 | 100.0% |
| Mathematical sciences | 1 | 100.0% |
| Physical sciences | 1 | 100.0% |
| Denmark (n=4) | ||
| Computer science | 3 | 75.0% |
| Biological sciences | 2 | 50.0% |
| Engineering and technology | 1 | 25.0% |
| Historical and philosophical studies | 1 | 25.0% |
| Mathematical sciences | 1 | 25.0% |
| Medicine and health sciences | 1 | 25.0% |
| Physical sciences | 1 | 25.0% |
| Veterinary science | 1 | 25.0% |
| Sweden (n=19) | ||
| Languages and linguistics | 9 | 47.4% |
| Computer science | 7 | 36.8% |
| Engineering and technology | 5 | 26.3% |
| Historical and philosophical studies | 5 | 26.3% |
| Physical sciences | 5 | 26.3% |
| Biological sciences | 4 | 21.1% |
| Creative arts and design | 4 | 21.1% |
| Medicine and health sciences | 3 | 15.8% |
| Social sciences | 3 | 15.8% |
| Education | 2 | 10.5% |
| Agriculture and related subjects | 1 | 5.3% |
| Architecture, building and planning | 1 | 5.3% |
| Norway (n=10) | ||
| Computer science | 9 | 90.0% |
| Mathematical sciences | 5 | 50.0% |
| Medicine and health sciences | 4 | 40.0% |
| Physical sciences | 4 | 40.0% |
| Social sciences | 3 | 30.0% |
| Biological sciences | 2 | 20.0% |
| Engineering and technology | 2 | 20.0% |
| Agriculture and related subjects | 1 | 10.0% |
| Finland (n=20) | ||
| Computer science | 16 | 84.2% |
| Biological sciences | 9 | 47.4% |
| Physical sciences | 9 | 47.4% |
| Medicine and health sciences | 7 | 36.8% |
| Engineering and technology | 5 | 26.3% |
| Education | 3 | 15.8% |
| Business | 2 | 10.5% |
| Mathematical sciences | 2 | 10.5% |
| Social sciences | 2 | 10.5% |
| Architecture, building and planning | 1 | 5.3% |
| Languages and linguistics | 1 | 5.3% |
| Law | 1 | 5.3% |
Warning: Removed 10 rows containing missing values or values outside the scale range
(`geom_text()`).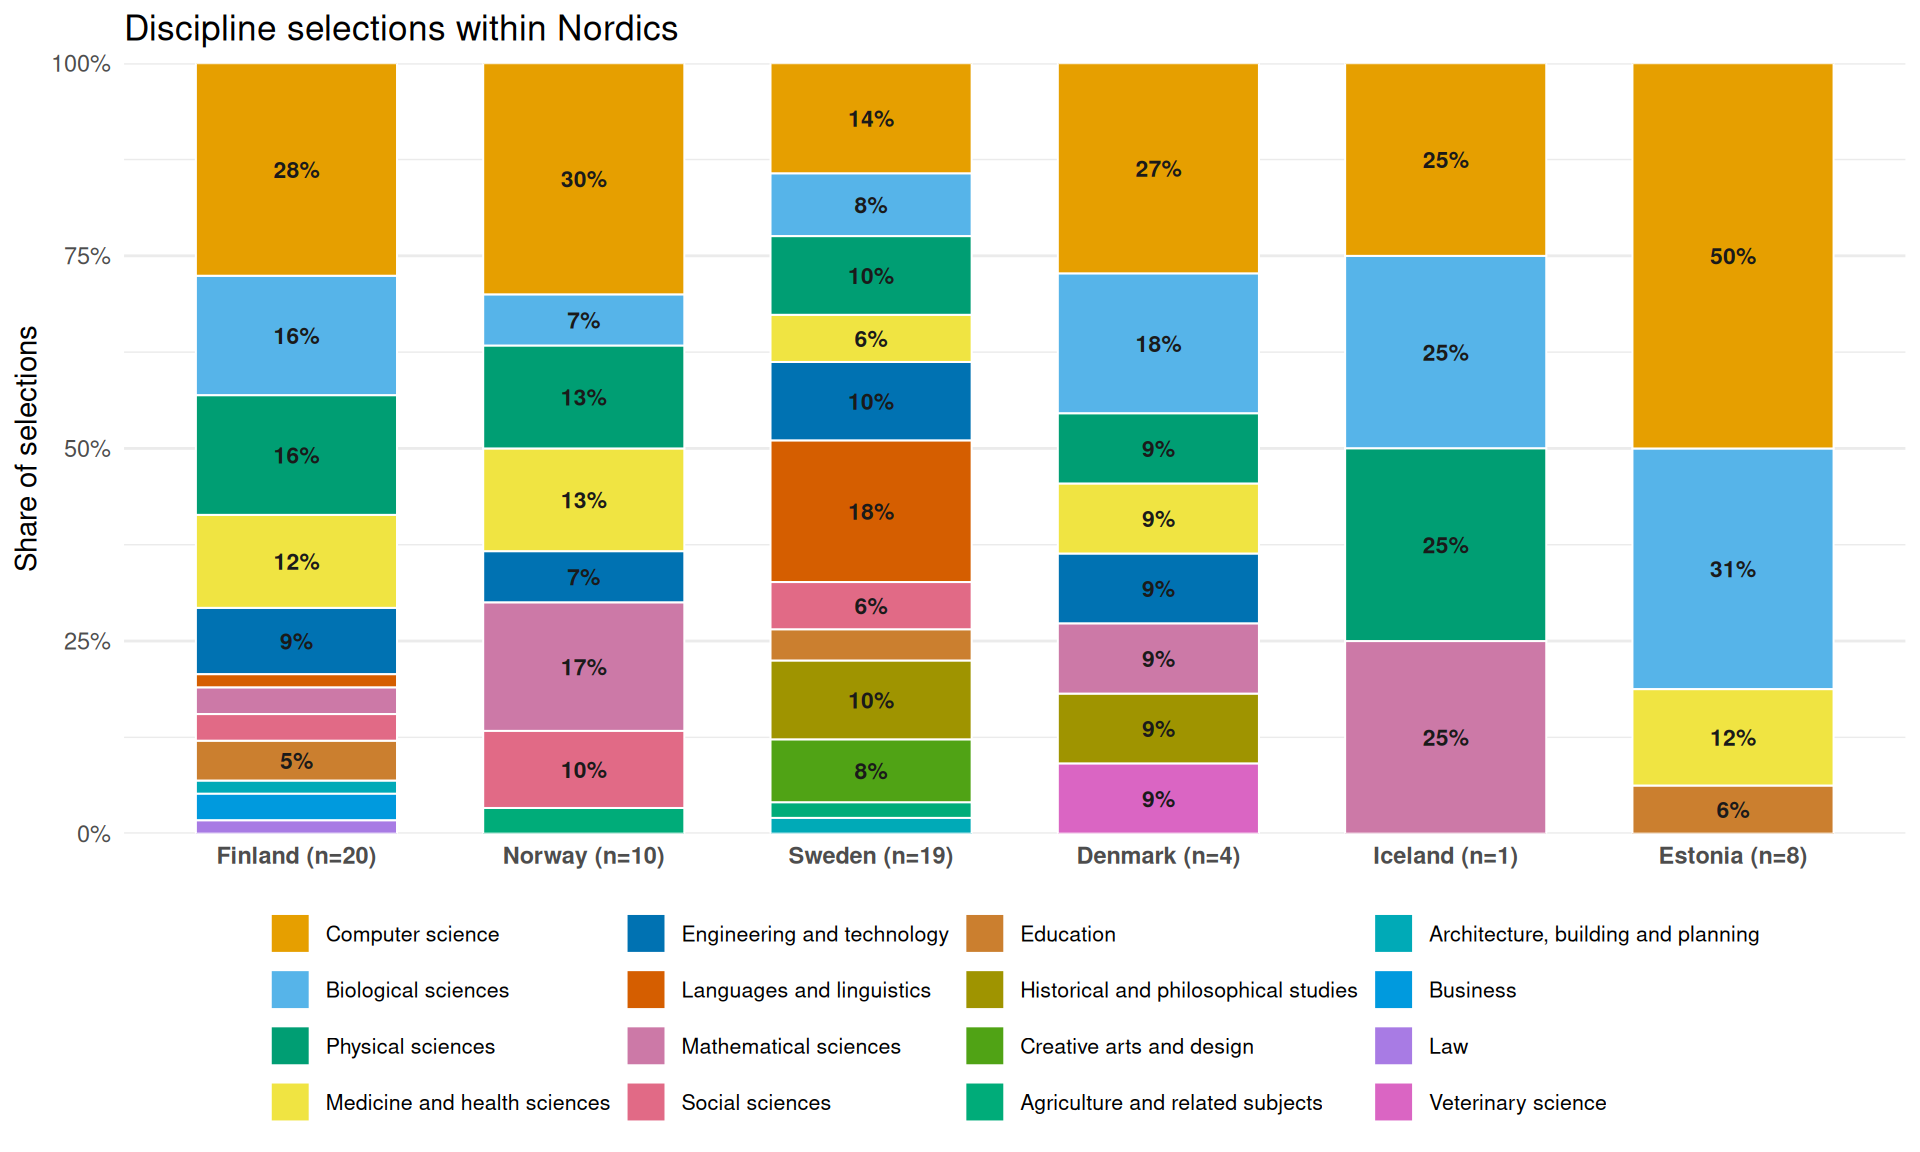
24.3 Between Countries
Warning: Removed 29 rows containing missing values or values outside the scale range
(`geom_text()`).