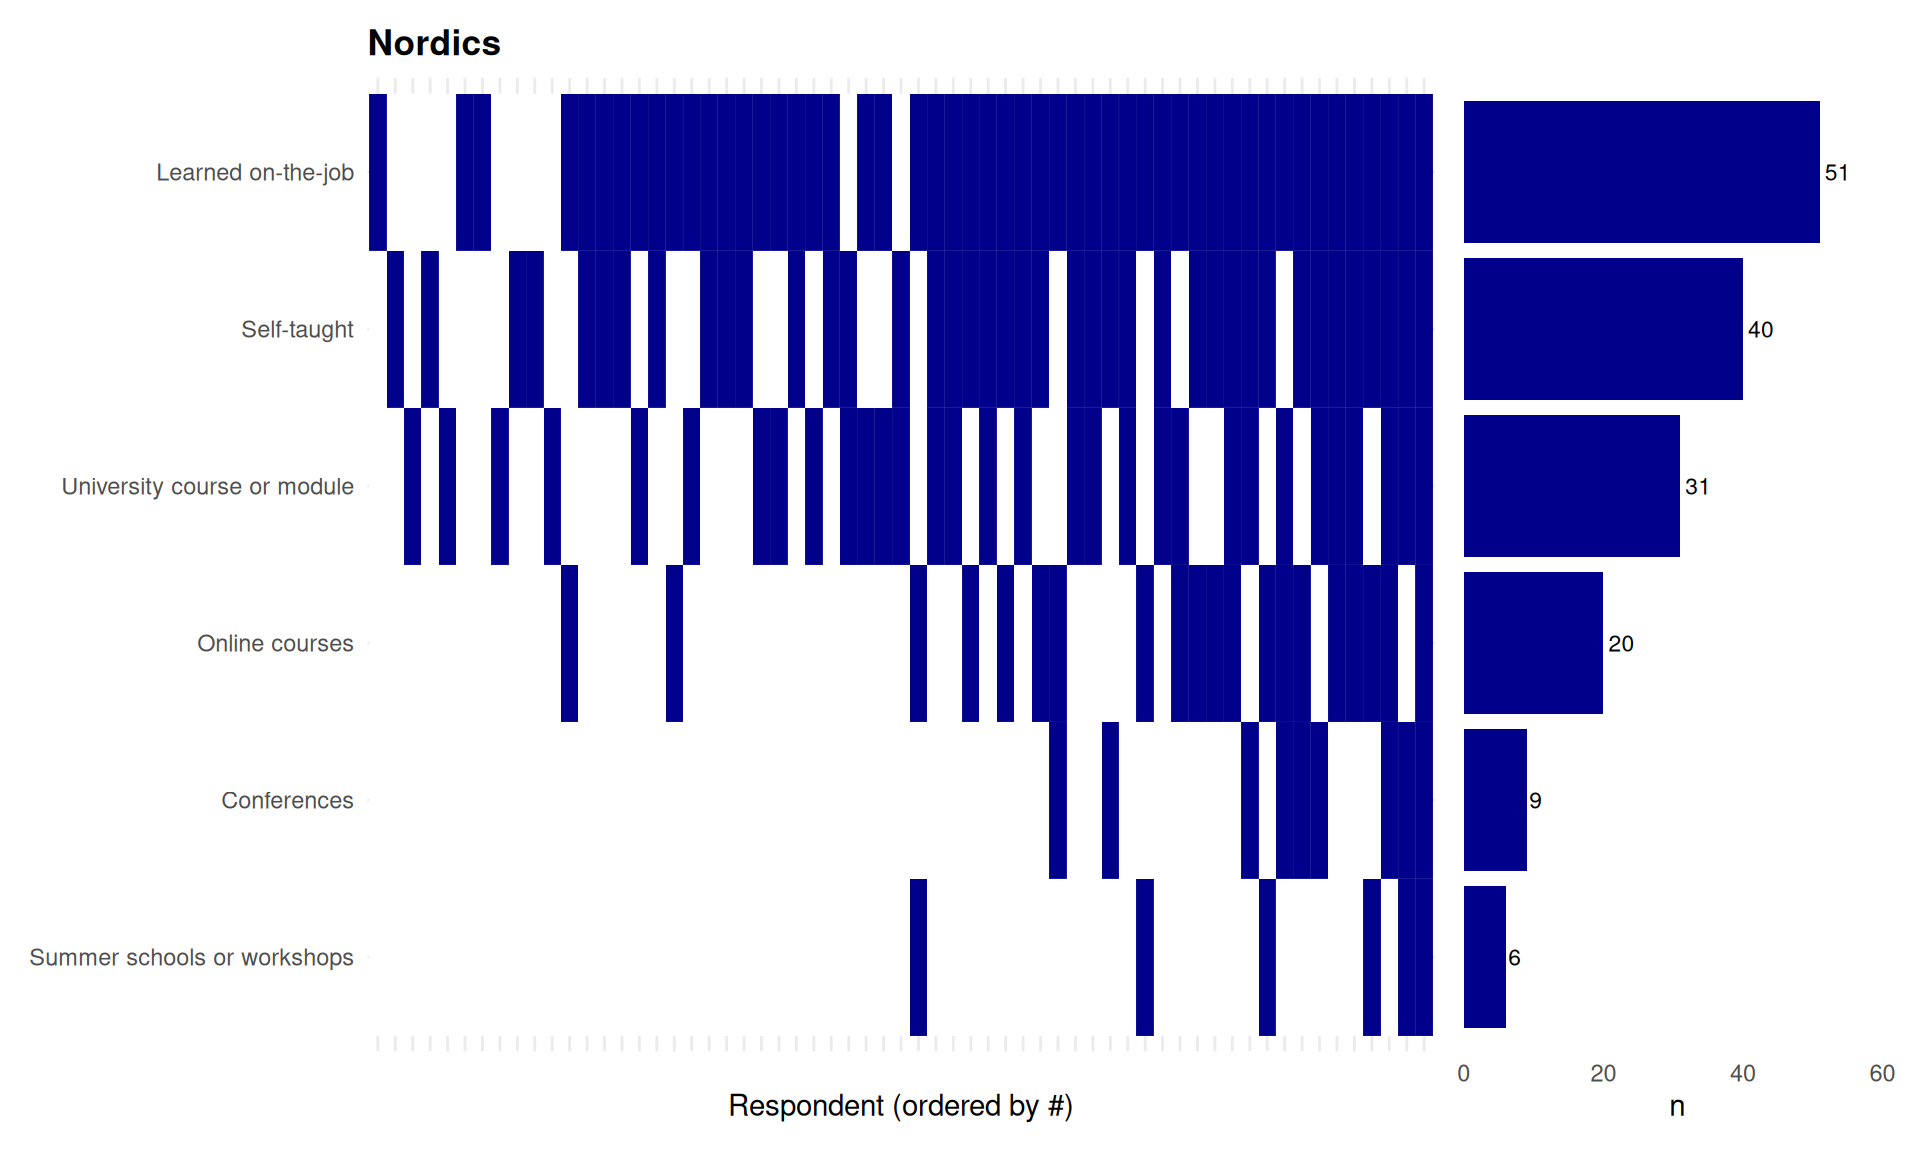
| Skill development (Nordics) | ||
| Total respondents: 61 | ||
| Category | Respondents (n) | Percentage (%) |
|---|---|---|
| Learned on-the-job | 51 | 83.6% |
| Self-taught | 40 | 65.6% |
| University course or module | 31 | 50.8% |
| Online courses | 20 | 32.8% |
| Conferences | 9 | 14.8% |
| Summer schools or workshops | 6 | 9.8% |
11 How did you learn the skills you need to become a Research Software Engineer / Research Software Developer?
11.1 Nordics
11.1.1 Descriptive Statistics
11.1.2 Free-text responses
| Skill Development [Others] | ||
| Response Category | Frequency (n) | Percentage (%) |
|---|---|---|
| Formal education (degrees/school) | 2 | 66.7% |
| Institutional/national HPC/RC training | 1 | 33.3% |
The raw-to-category allocation table for this question is in Appendix B.
11.1.3 Statistics by age group
| Skill development by age group (Nordics) | ||||||||
| Total respondents with age reported: 61. Rows are ranked separately within each age group by respondent count. | ||||||||
Below 35 (n=20)
|
35-45 (n=27)
|
45+ (n=14)
|
||||||
|---|---|---|---|---|---|---|---|---|
| Category | Respondents (n) | Percentage (%) | Category | Respondents (n) | Percentage (%) | Category | Respondents (n) | Percentage (%) |
| Learned on-the-job | 17 | 85.0% | Learned on-the-job | 22 | 81.5% | Learned on-the-job | 12 | 85.7% |
| Self-taught | 13 | 65.0% | Self-taught | 17 | 63.0% | Self-taught | 10 | 71.4% |
| University course or module | 11 | 55.0% | University course or module | 15 | 55.6% | University course or module | 5 | 35.7% |
| Online courses | 9 | 45.0% | Online courses | 10 | 37.0% | Conferences | 2 | 14.3% |
| Conferences | 2 | 10.0% | Conferences | 5 | 18.5% | Online courses | 1 | 7.1% |
| Summer schools or workshops | 1 | 5.0% | Summer schools or workshops | 5 | 18.5% | |||
11.2 Within Nordics
| Skill development selections within Nordics | ||
| Total respondents: 61. Percentages are within each country. | ||
| Category | Respondents (n) | Percentage (%) |
|---|---|---|
| Estonia (n=8) | ||
| Learned on-the-job | 8 | 100.0% |
| Self-taught | 6 | 75.0% |
| Online courses | 4 | 50.0% |
| University course or module | 4 | 50.0% |
| Conferences | 2 | 25.0% |
| Summer schools or workshops | 1 | 12.5% |
| Iceland (n=1) | ||
| Self-taught | 1 | 100.0% |
| Denmark (n=4) | ||
| Learned on-the-job | 4 | 100.0% |
| Self-taught | 3 | 75.0% |
| University course or module | 3 | 75.0% |
| Conferences | 1 | 25.0% |
| Online courses | 1 | 25.0% |
| Sweden (n=19) | ||
| Learned on-the-job | 13 | 68.4% |
| University course or module | 11 | 57.9% |
| Self-taught | 10 | 52.6% |
| Online courses | 4 | 21.1% |
| Summer schools or workshops | 2 | 10.5% |
| Norway (n=9) | ||
| Learned on-the-job | 7 | 77.8% |
| Self-taught | 7 | 77.8% |
| University course or module | 5 | 55.6% |
| Online courses | 3 | 33.3% |
| Conferences | 1 | 11.1% |
| Finland (n=20) | ||
| Learned on-the-job | 19 | 95.0% |
| Self-taught | 13 | 65.0% |
| Online courses | 8 | 40.0% |
| University course or module | 8 | 40.0% |
| Conferences | 5 | 25.0% |
| Summer schools or workshops | 3 | 15.0% |
Warning: Removed 2 rows containing missing values or values outside the scale range
(`geom_text()`).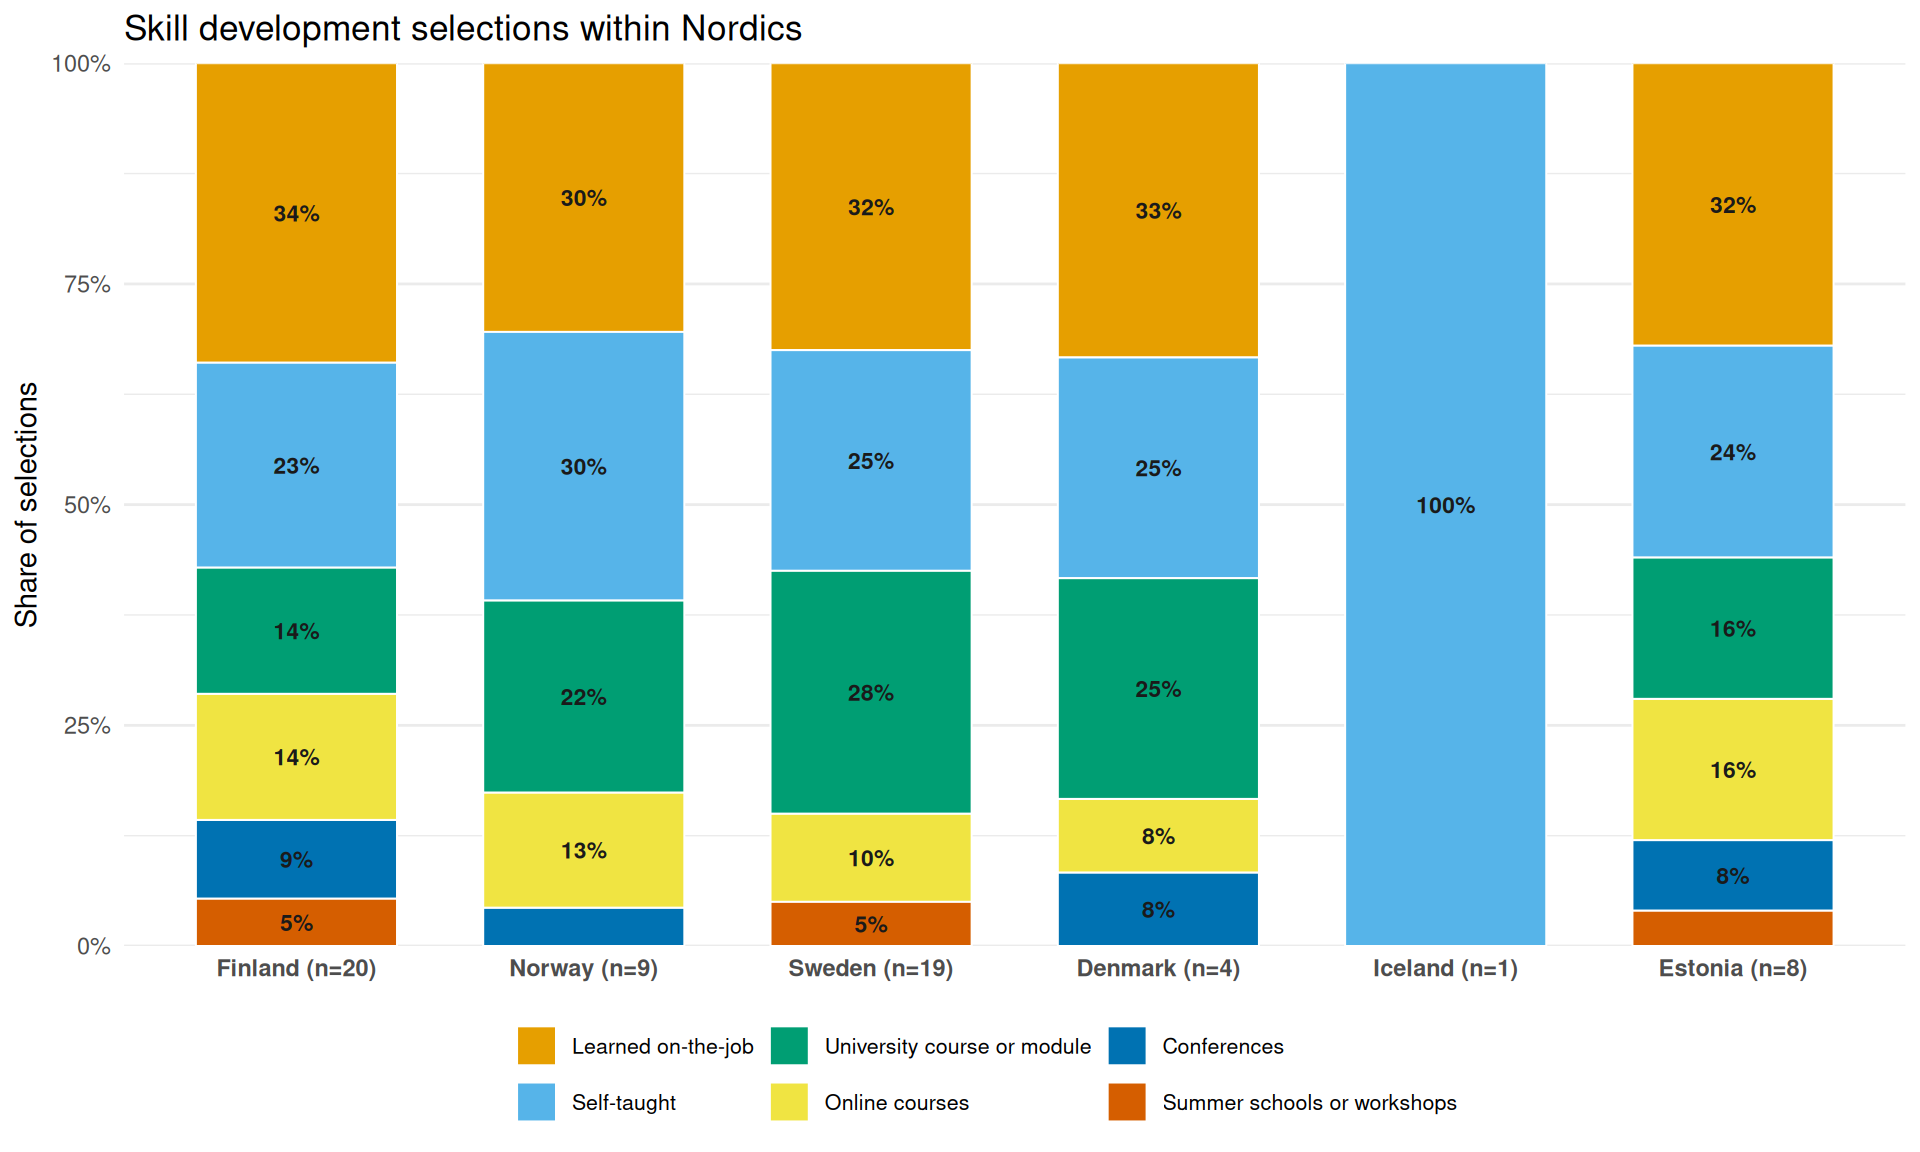
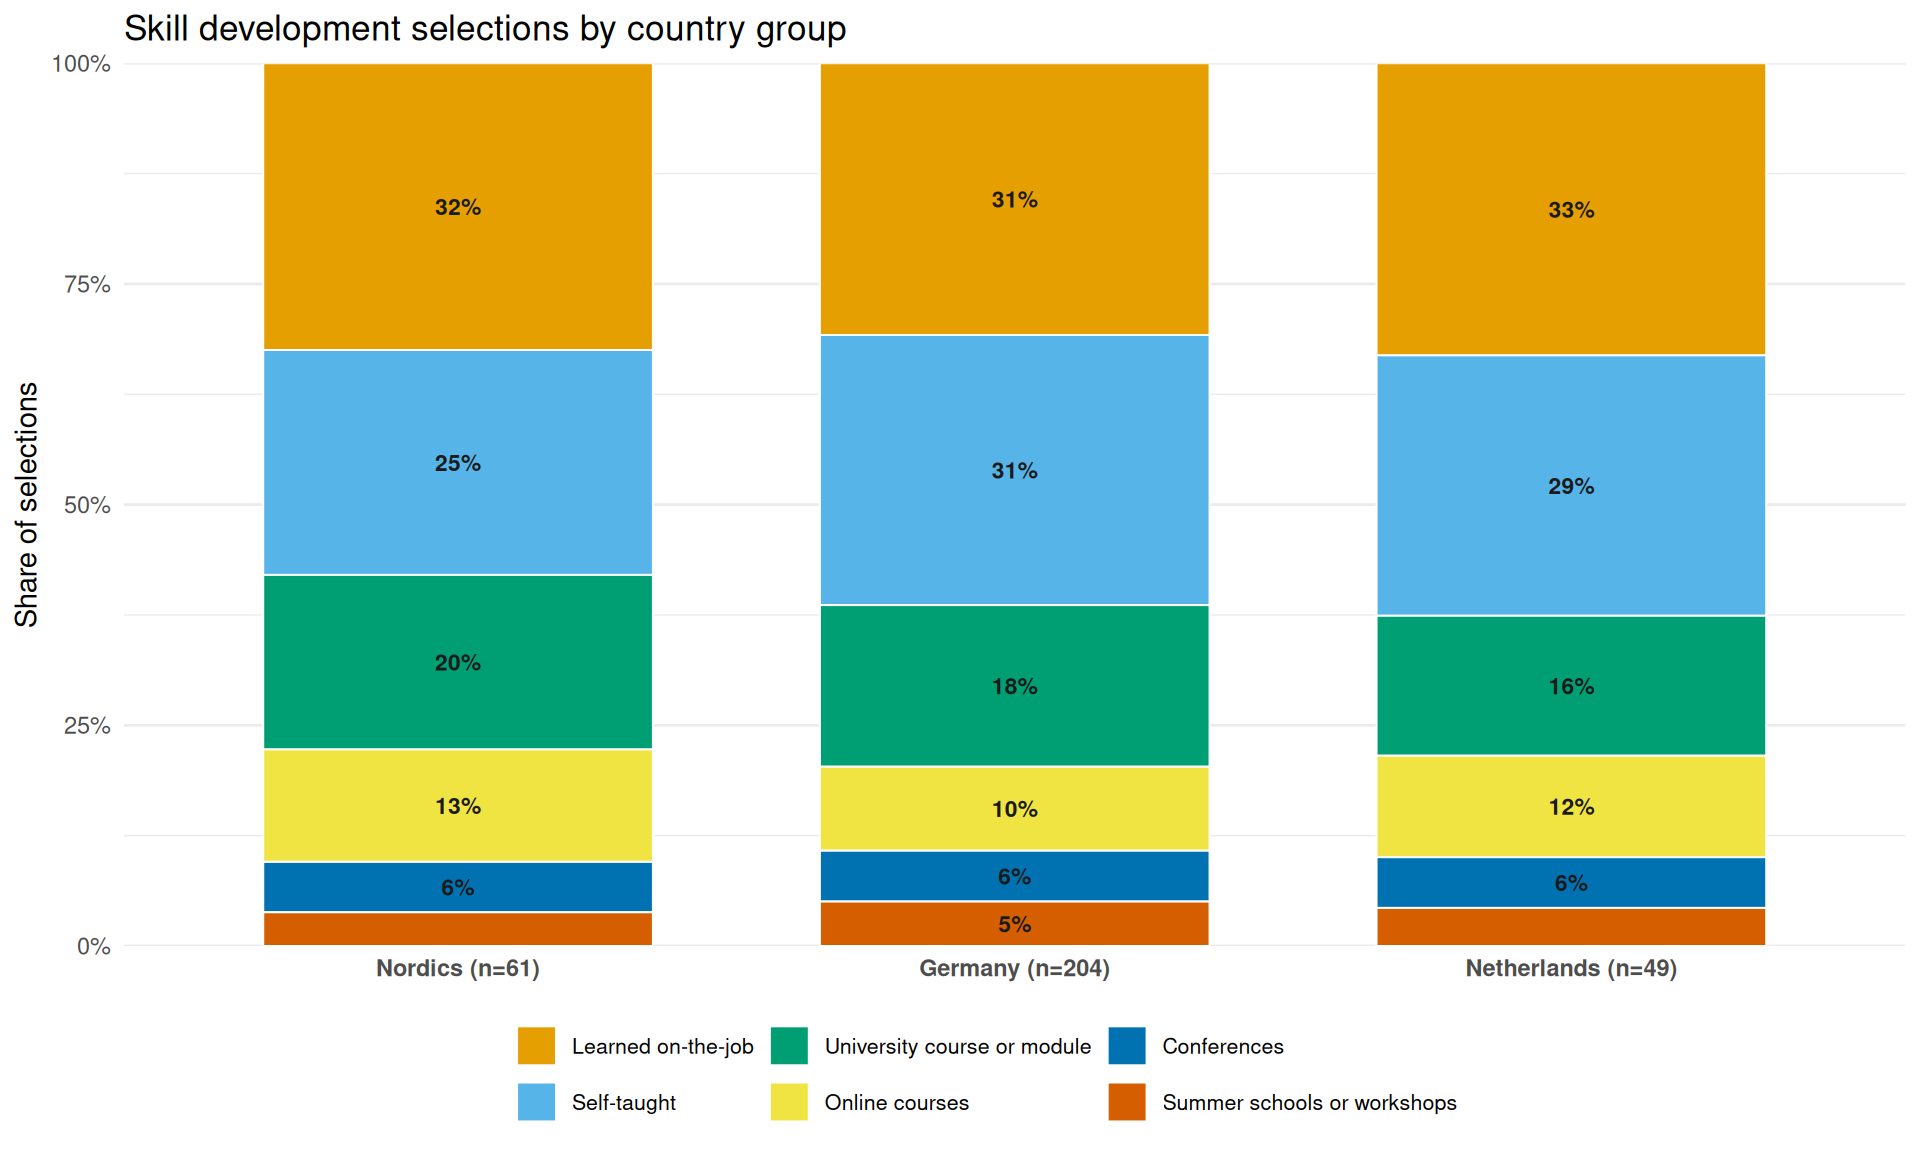
11.3 Between Countries
Warning: Removed 2 rows containing missing values or values outside the scale range
(`geom_text()`).