| Training capacity (Nordics) | ||
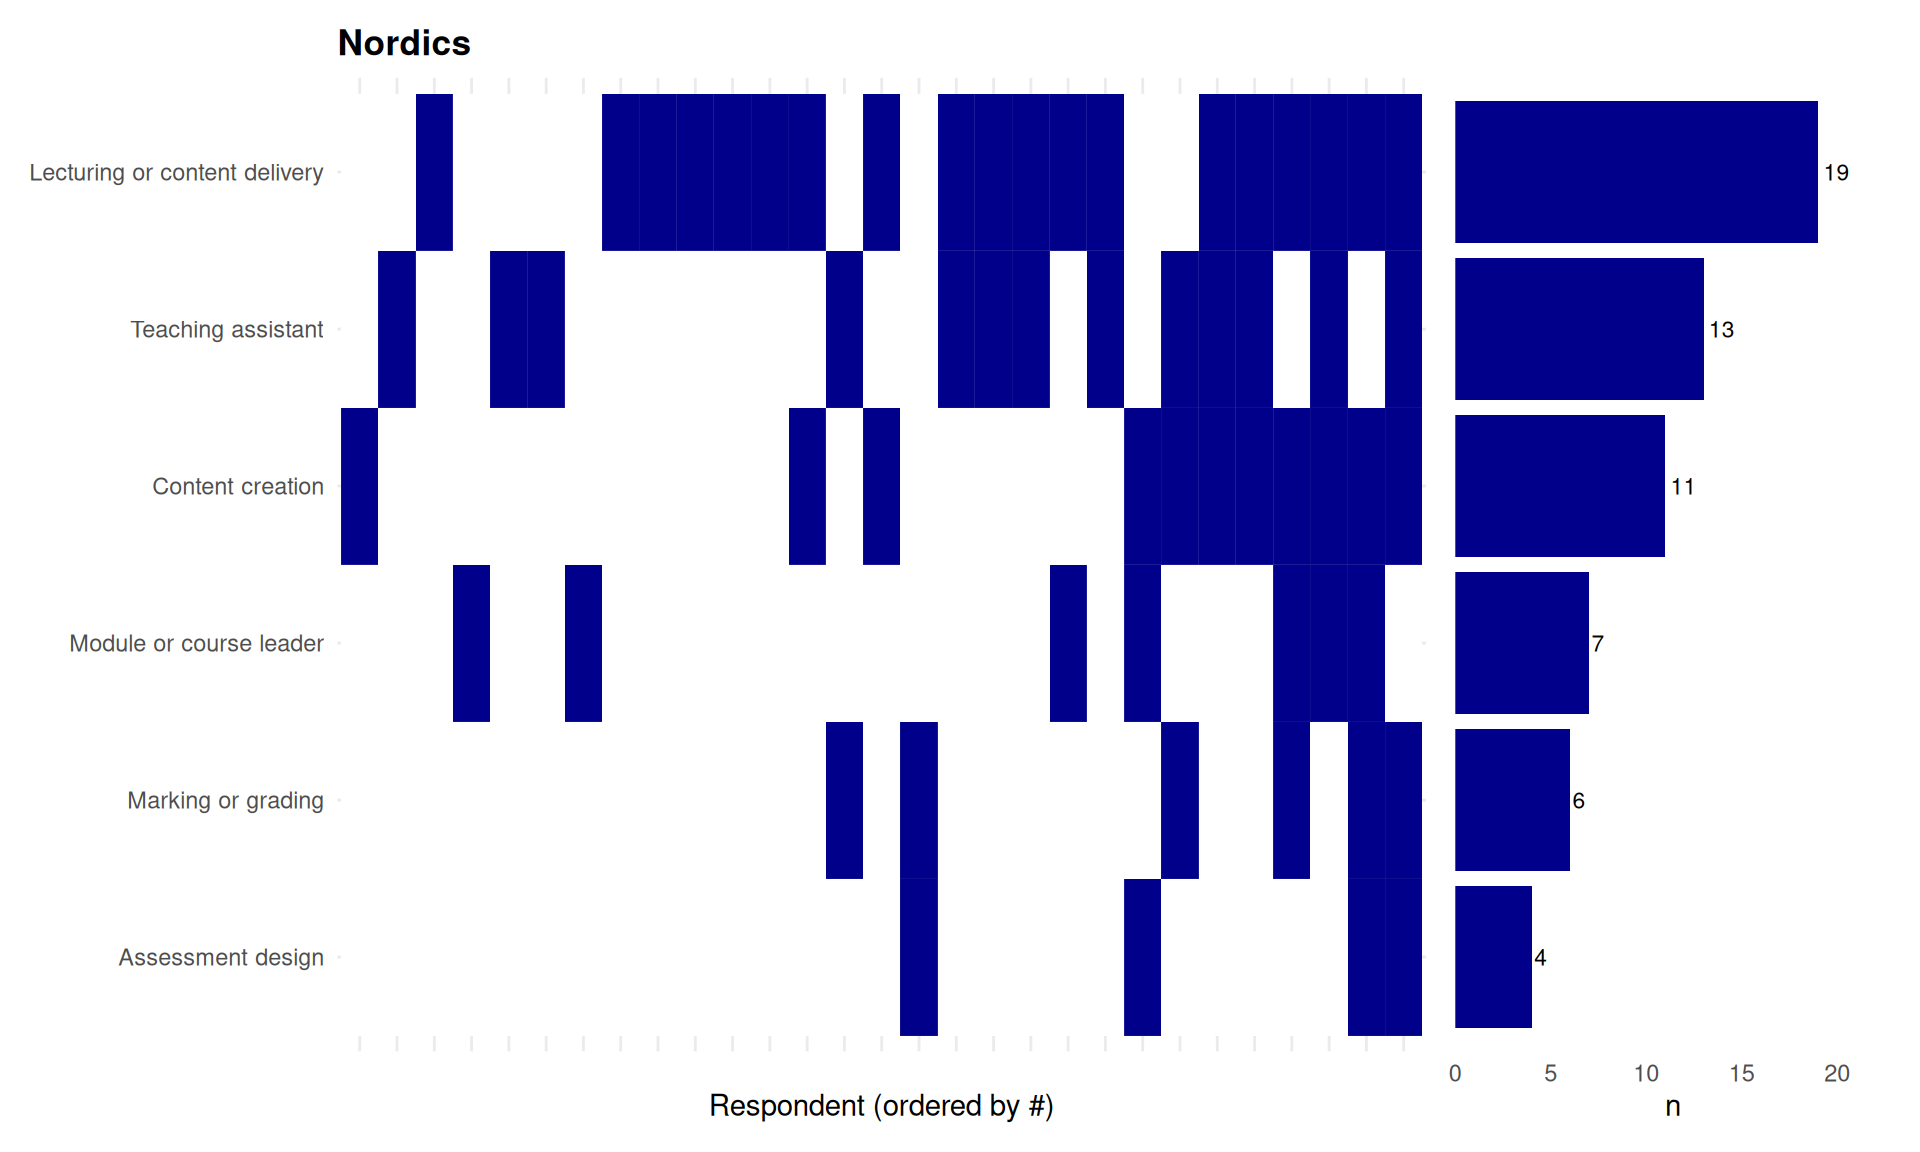
| Total respondents: 29 | ||
| Category | Respondents (n) | Percentage (%) |
|---|---|---|
| Lecturing or content delivery | 19 | 65.5% |
| Teaching assistant | 13 | 44.8% |
| Content creation | 11 | 37.9% |
| Module or course leader | 7 | 24.1% |
| Marking or grading | 6 | 20.7% |
| Assessment design | 4 | 13.8% |
53 In what capacity do you contribute?
53.1 Nordics
53.1.1 Descriptive Statistics
53.1.2 Free-text responses
| Training Capacity [Others] | ||
| Response Category | Frequency (n) | Percentage (%) |
|---|---|---|
| Course materials/infrastructure development | 1 | 33.3% |
| Lecturer / instructor | 1 | 33.3% |
| Practical/lab instructor | 1 | 33.3% |
The raw-to-category allocation table for this question is in Appendix B.
53.1.3 Statistics by age group
| Training capacity by age group (Nordics) | ||||||||
| Total respondents with age reported: 29. Rows are ranked separately within each age group by respondent count. | ||||||||
Below 35 (n=11)
|
35-45 (n=13)
|
45+ (n=5)
|
||||||
|---|---|---|---|---|---|---|---|---|
| Category | Respondents (n) | Percentage (%) | Category | Respondents (n) | Percentage (%) | Category | Respondents (n) | Percentage (%) |
| Lecturing or content delivery | 8 | 72.7% | Lecturing or content delivery | 8 | 61.5% | Teaching assistant | 4 | 80.0% |
| Teaching assistant | 6 | 54.5% | Content creation | 6 | 46.2% | Lecturing or content delivery | 3 | 60.0% |
| Content creation | 3 | 27.3% | Module or course leader | 4 | 30.8% | Content creation | 2 | 40.0% |
| Module or course leader | 3 | 27.3% | Teaching assistant | 3 | 23.1% | Marking or grading | 2 | 40.0% |
| Marking or grading | 2 | 18.2% | Assessment design | 2 | 15.4% | Assessment design | 1 | 20.0% |
| Assessment design | 1 | 9.1% | Marking or grading | 2 | 15.4% | |||
53.2 Within Nordics
| Training capacity selections within Nordics | ||
| Total respondents: 29. Percentages are within each country. | ||
| Category | Respondents (n) | Percentage (%) |
|---|---|---|
| Estonia (n=3) | ||
| Lecturing or content delivery | 1 | 33.3% |
| Module or course leader | 1 | 33.3% |
| Teaching assistant | 1 | 33.3% |
| Iceland (n=1) | ||
| Content creation | 1 | 100.0% |
| Lecturing or content delivery | 1 | 100.0% |
| Marking or grading | 1 | 100.0% |
| Module or course leader | 1 | 100.0% |
| Denmark (n=2) | ||
| Module or course leader | 1 | 50.0% |
| Teaching assistant | 1 | 50.0% |
| Sweden (n=10) | ||
| Lecturing or content delivery | 7 | 70.0% |
| Content creation | 4 | 40.0% |
| Teaching assistant | 4 | 40.0% |
| Marking or grading | 3 | 30.0% |
| Assessment design | 2 | 20.0% |
| Norway (n=3) | ||
| Content creation | 1 | 33.3% |
| Lecturing or content delivery | 1 | 33.3% |
| Marking or grading | 1 | 33.3% |
| Module or course leader | 1 | 33.3% |
| Teaching assistant | 1 | 33.3% |
| Finland (n=10) | ||
| Lecturing or content delivery | 9 | 90.0% |
| Teaching assistant | 6 | 60.0% |
| Content creation | 5 | 50.0% |
| Module or course leader | 3 | 30.0% |
| Assessment design | 2 | 20.0% |
| Marking or grading | 1 | 10.0% |
Warning: Removed 1 row containing missing values or values outside the scale range
(`geom_text()`).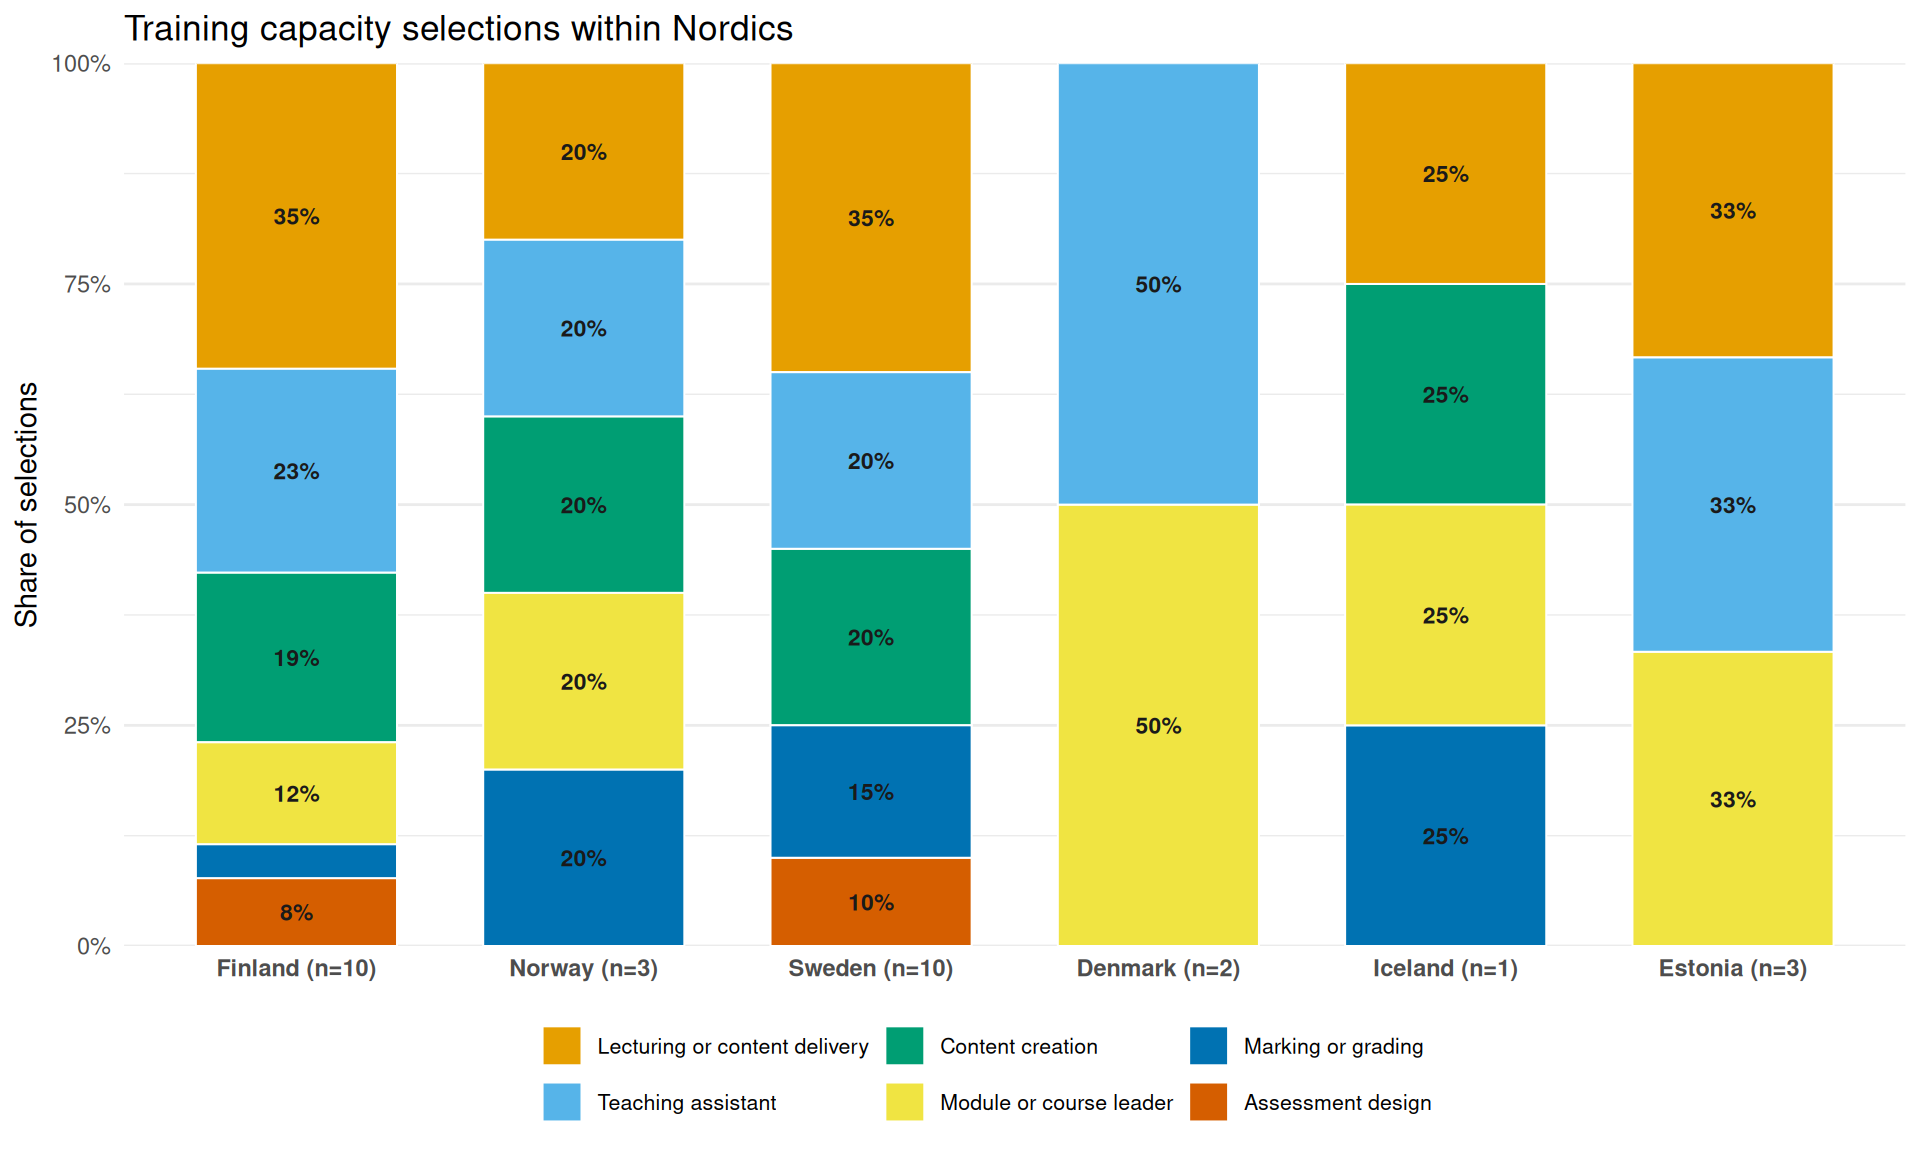
53.3 Between Countries