International RSE Survey 2026
Nordic RSEs: satisfied, skilled and in demand but looking for clearer career paths
Nordic insights
This post shows results from the 5th international RSE survey that ran in early 2026. Over 950 Research Software Engineers from 55 countries shared insights into their career and interests.
The full dataset is available for download at https://github.com/softwaresaved/RSE_survey_longitudinal/. An interactive dashboard with all international RSE survey data is available at https://rse-survey.soton.ac.uk/superset/dashboard/RSE_survey/.
The analysis below is based on 62 submitted responses from the Nordic countries. Percentages are calculated from the respondents who answered each question, so the number of responses may vary slightly between questions.
Most submitted responses came from Finland (32.3%), Sweden (30.6%), and Norway (16.1%), followed by Estonia (12.9%), Denmark (6.5%), and Iceland (1.6%).
The sample spans early-career and mid-career respondents. The most common age groups were 35 to 44 years (44.3%) and 25 to 34 years (32.8%), followed by 45 to 54 years (18.0%). In the analysis below, we use three age groups: under 35, 35-45, and 45+.
Interdisciplinary RSE community: Broad but concentrated in STEM
Nordic RSEs work across many disciplines, but the survey responses are strongly concentrated in STEM fields.
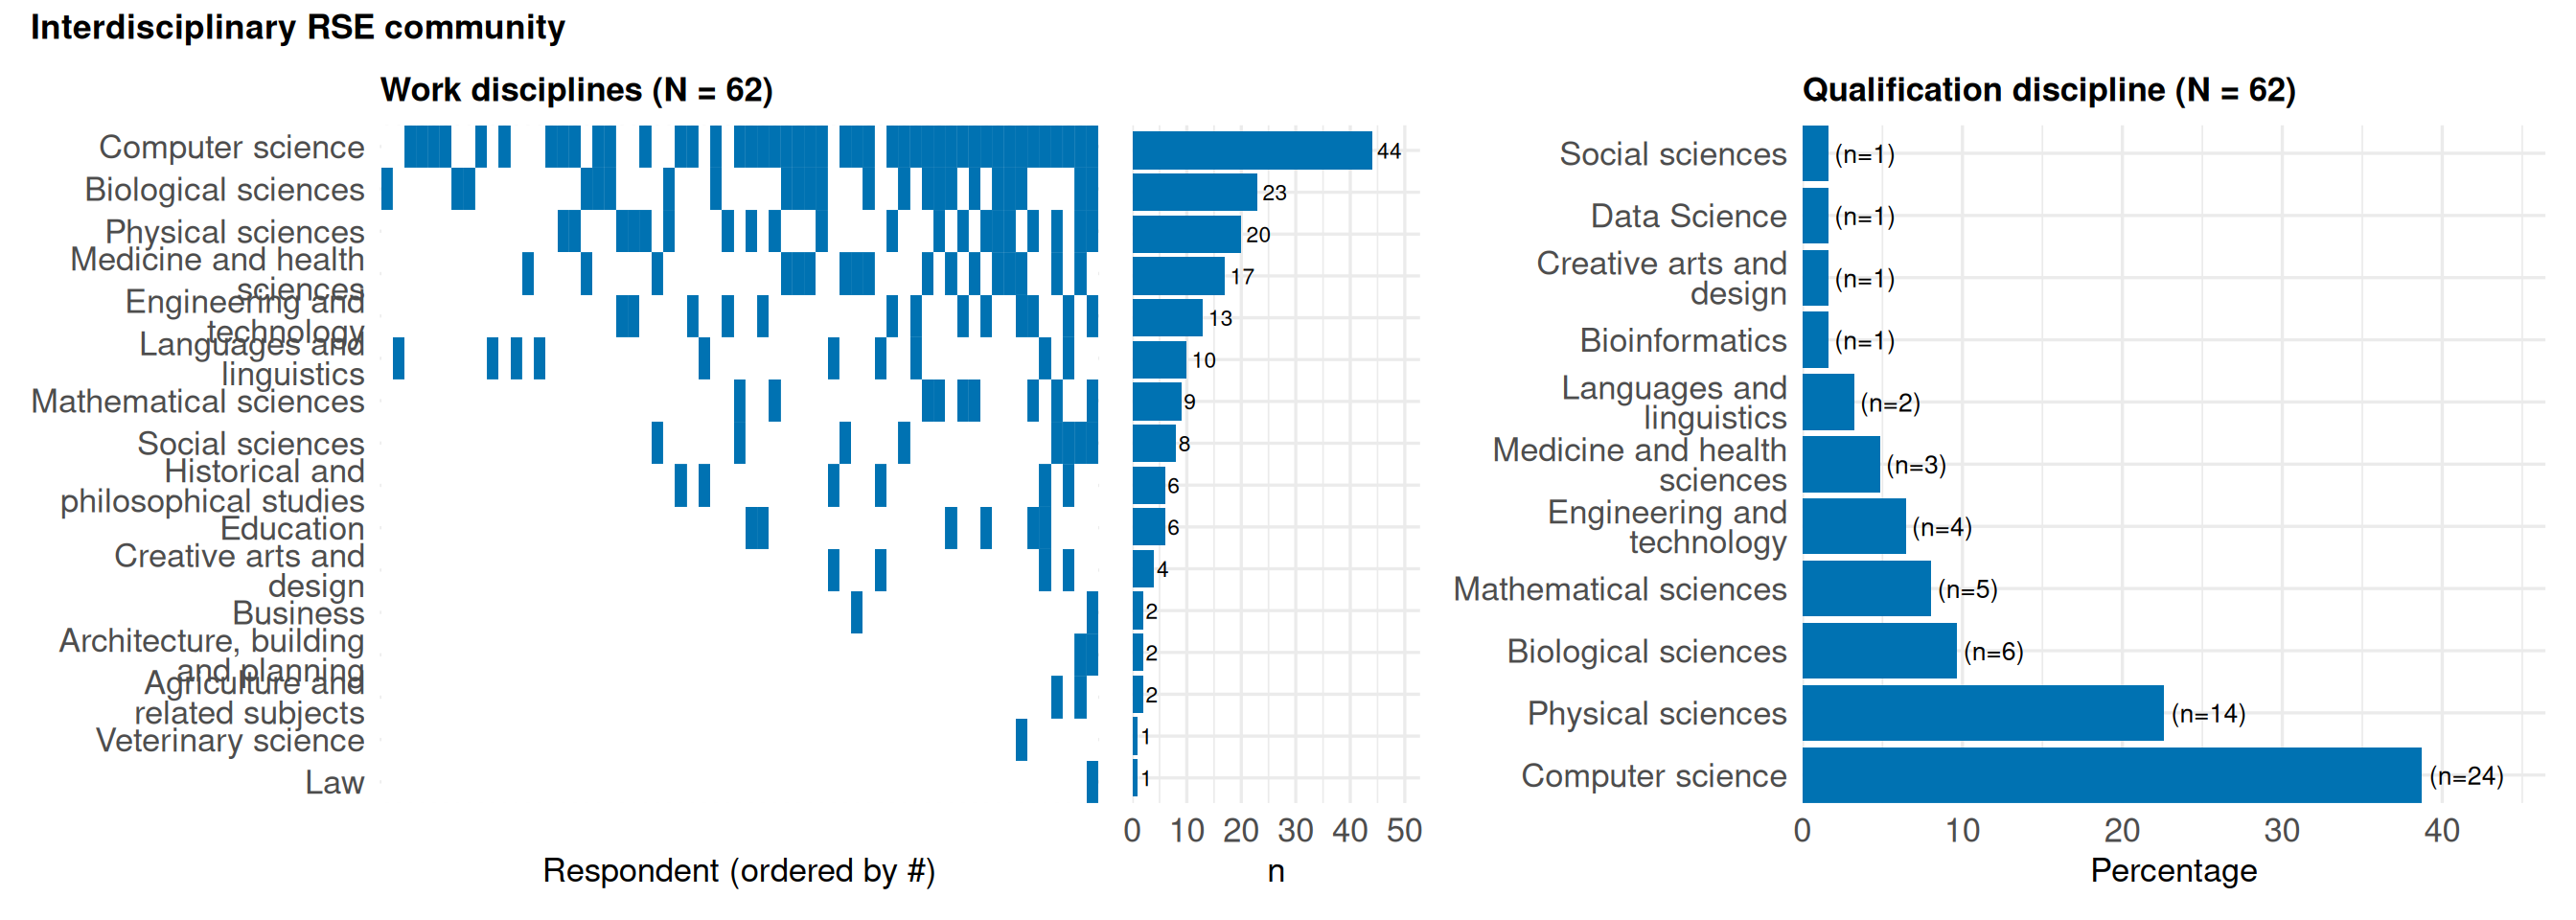
Computer Science was the most common work area, selected by 71.0% of respondents. This was followed by Biological Sciences (37.1%), Physical Sciences (32.3%), and Medicine/Health Sciences (27.4%).
Computer Science was also the most common disciplinary background, selected by 38.7%. Physical Sciences followed at 22.6%, Biological Sciences at 9.7%, and Mathematical Sciences at 8.1%.
Most respondents had advanced academic qualifications: 54.8% held a PhD and 40.3% held a Master’s degree.
NoteKey finding
The Nordic RSE community is strongly rooted in computing, but RSE work supports many scientific domains. However, survey responses are strongly concentrated in STEM while social sciences appear underrepresented.
RSE role and software experience
Software development is central to the work of most respondents. 93.5% write software for academic research as part of their job, and 67.2% consider themselves professional software developers.
Many also have substantial experience: 35.5% reported 15+ years of software development experience, followed by 10 years (17.7%) and 5 years (11.3%).
Most respondents are not primarily in leadership roles. Only 8.2% said that most of their role consists of leading a group of software developers or RSEs.
The software they develop is often used beyond an individual researcher. 75.9% reported writing software for more than two users.
Employment and job titles
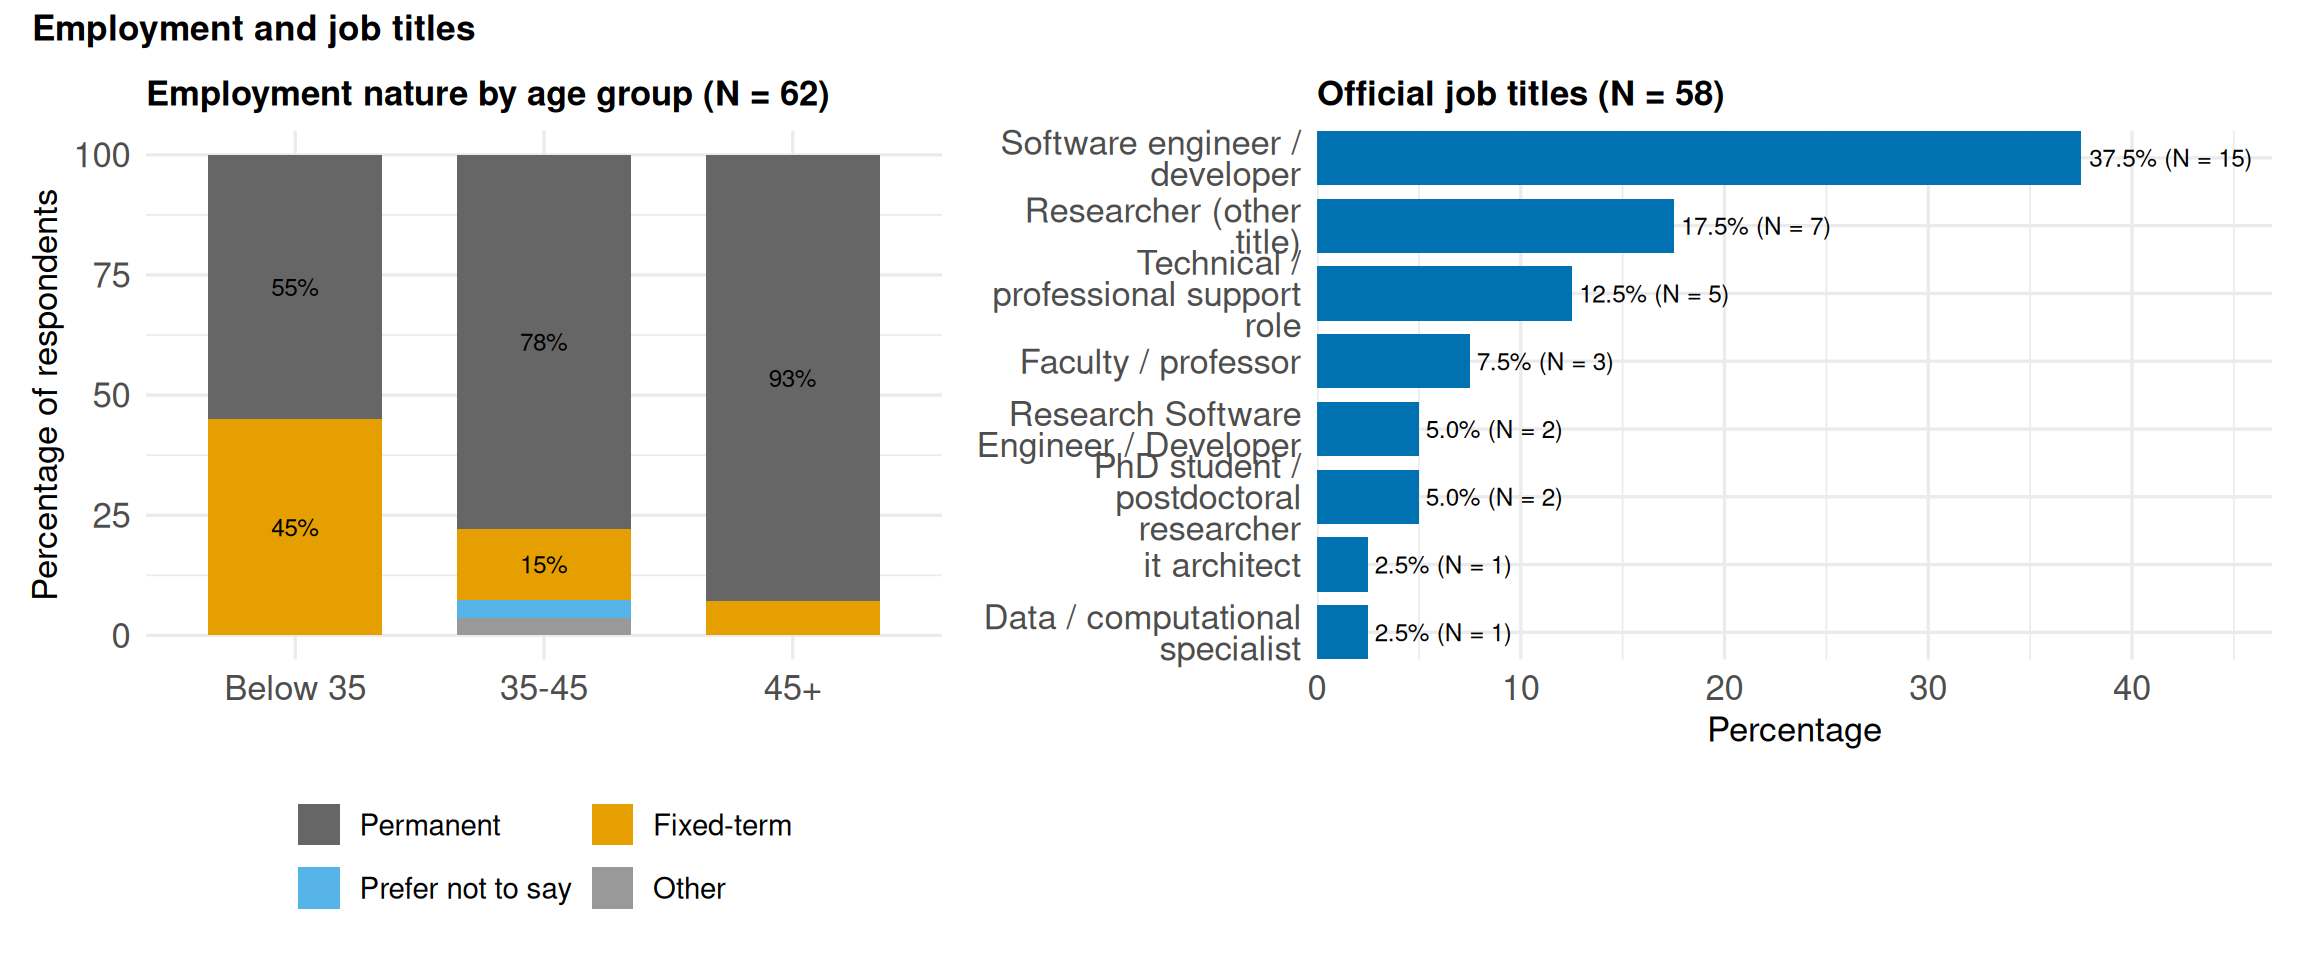
Most respondents reported relatively stable employment conditions. 74.2% were in permanent employment, 22.6% were on fixed-term contracts, and 95.2% worked full time.
Among respondents under 35, permanent and fixed-term positions were more evenly balanced: 55.0% permanent and 45.0% fixed-term. This may reflect the fact that many younger respondents are in PhD or postdoctoral positions, which are usually fixed-term.
Job titles varied widely. Respondents reported their job titles in free text, which we grouped into broader categories. The most common was Software Engineer or Developer (37.5%), followed by Researcher (17.5%), Technical/Professional Support Role (12.5%), and Faculty/Professor (7.5%).
In addition, 30.9% said they are known within their group by a different job title than their official one. This highlights that RSE work is often present even when the formal title does not say “Research Software Engineer”.
Most respondents work in universities (79.0%). Universities were also the most common background for respondents’ previous role (51.6%), followed by private companies (22.6%).
NoteKey finding
Most respondents are in permanent, full-time employment, but fixed-term contracts are more common among younger respondents. RSE work also appears under different job titles.
Time allocation: protecting time for software and research
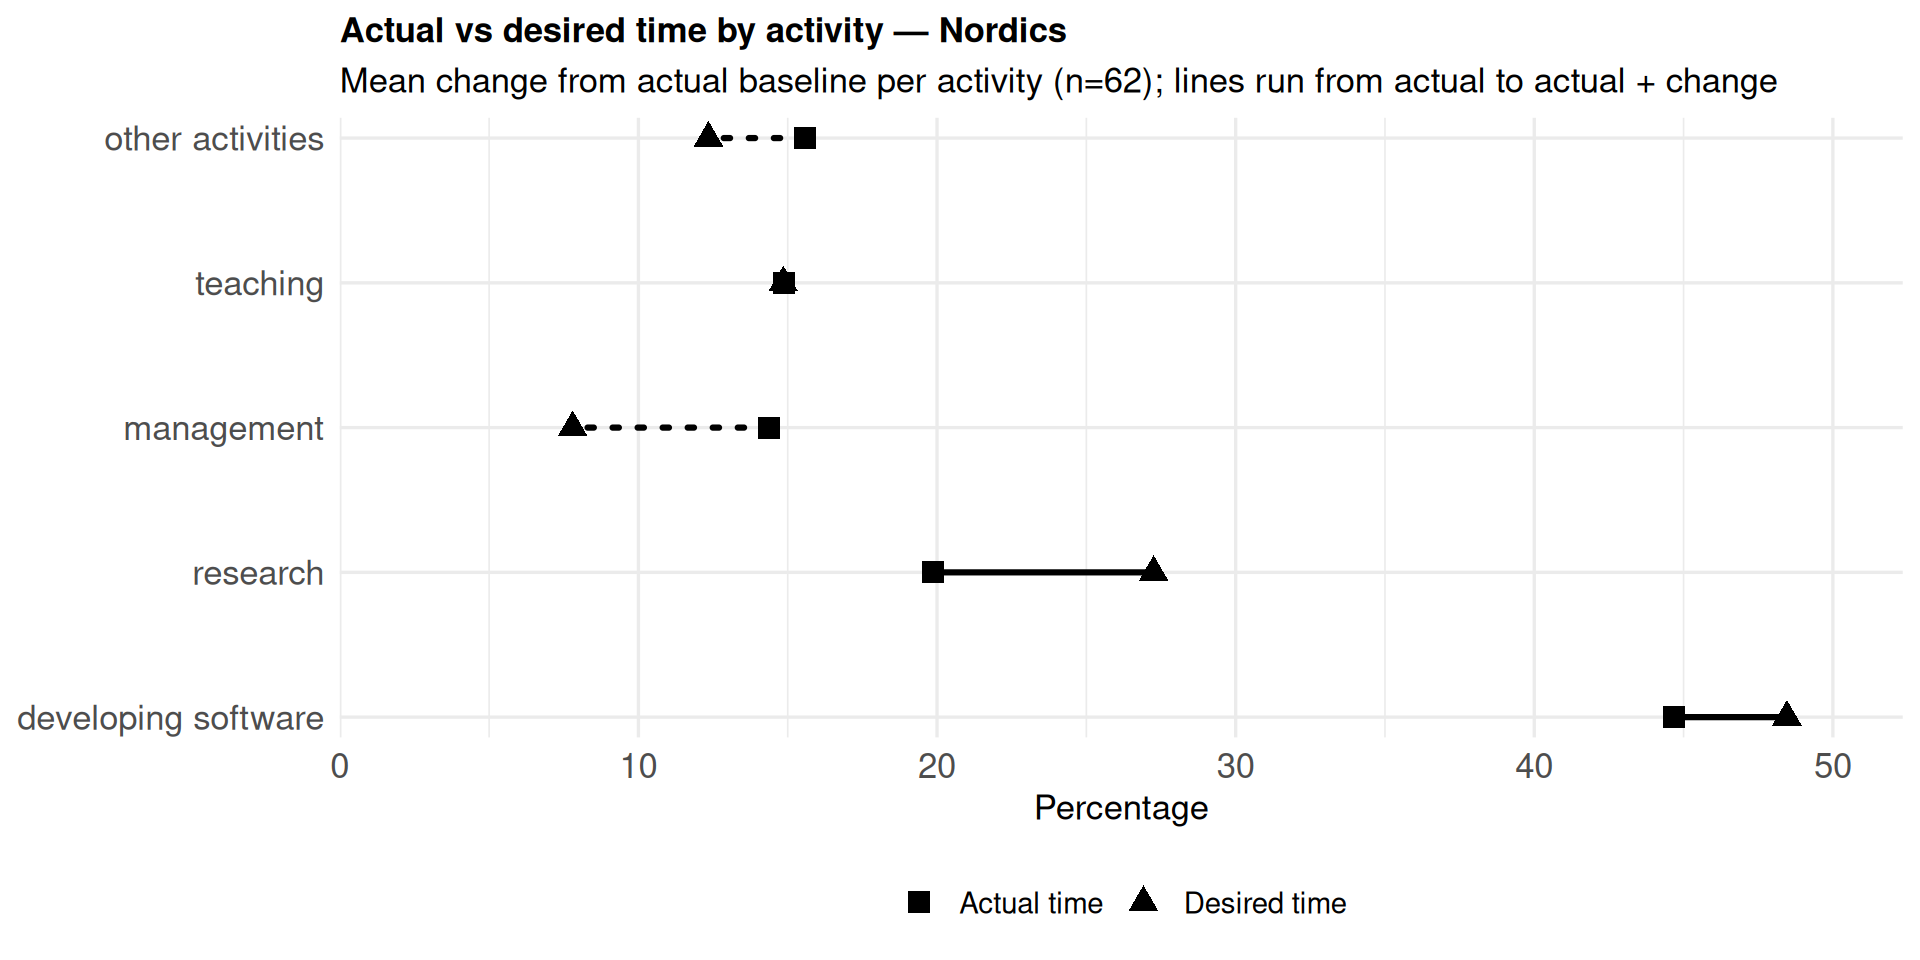
Software development took the largest share of working time, at 44.7% on average. This was followed by research (19.9%), other activities (15.6%), teaching (14.9%), and management (14.4%).
When asked how they would prefer to spend their time, respondents wanted more time for software development and research, and less time for management and other activities. The largest desired reduction was in management time, at -6.6 percentage points.
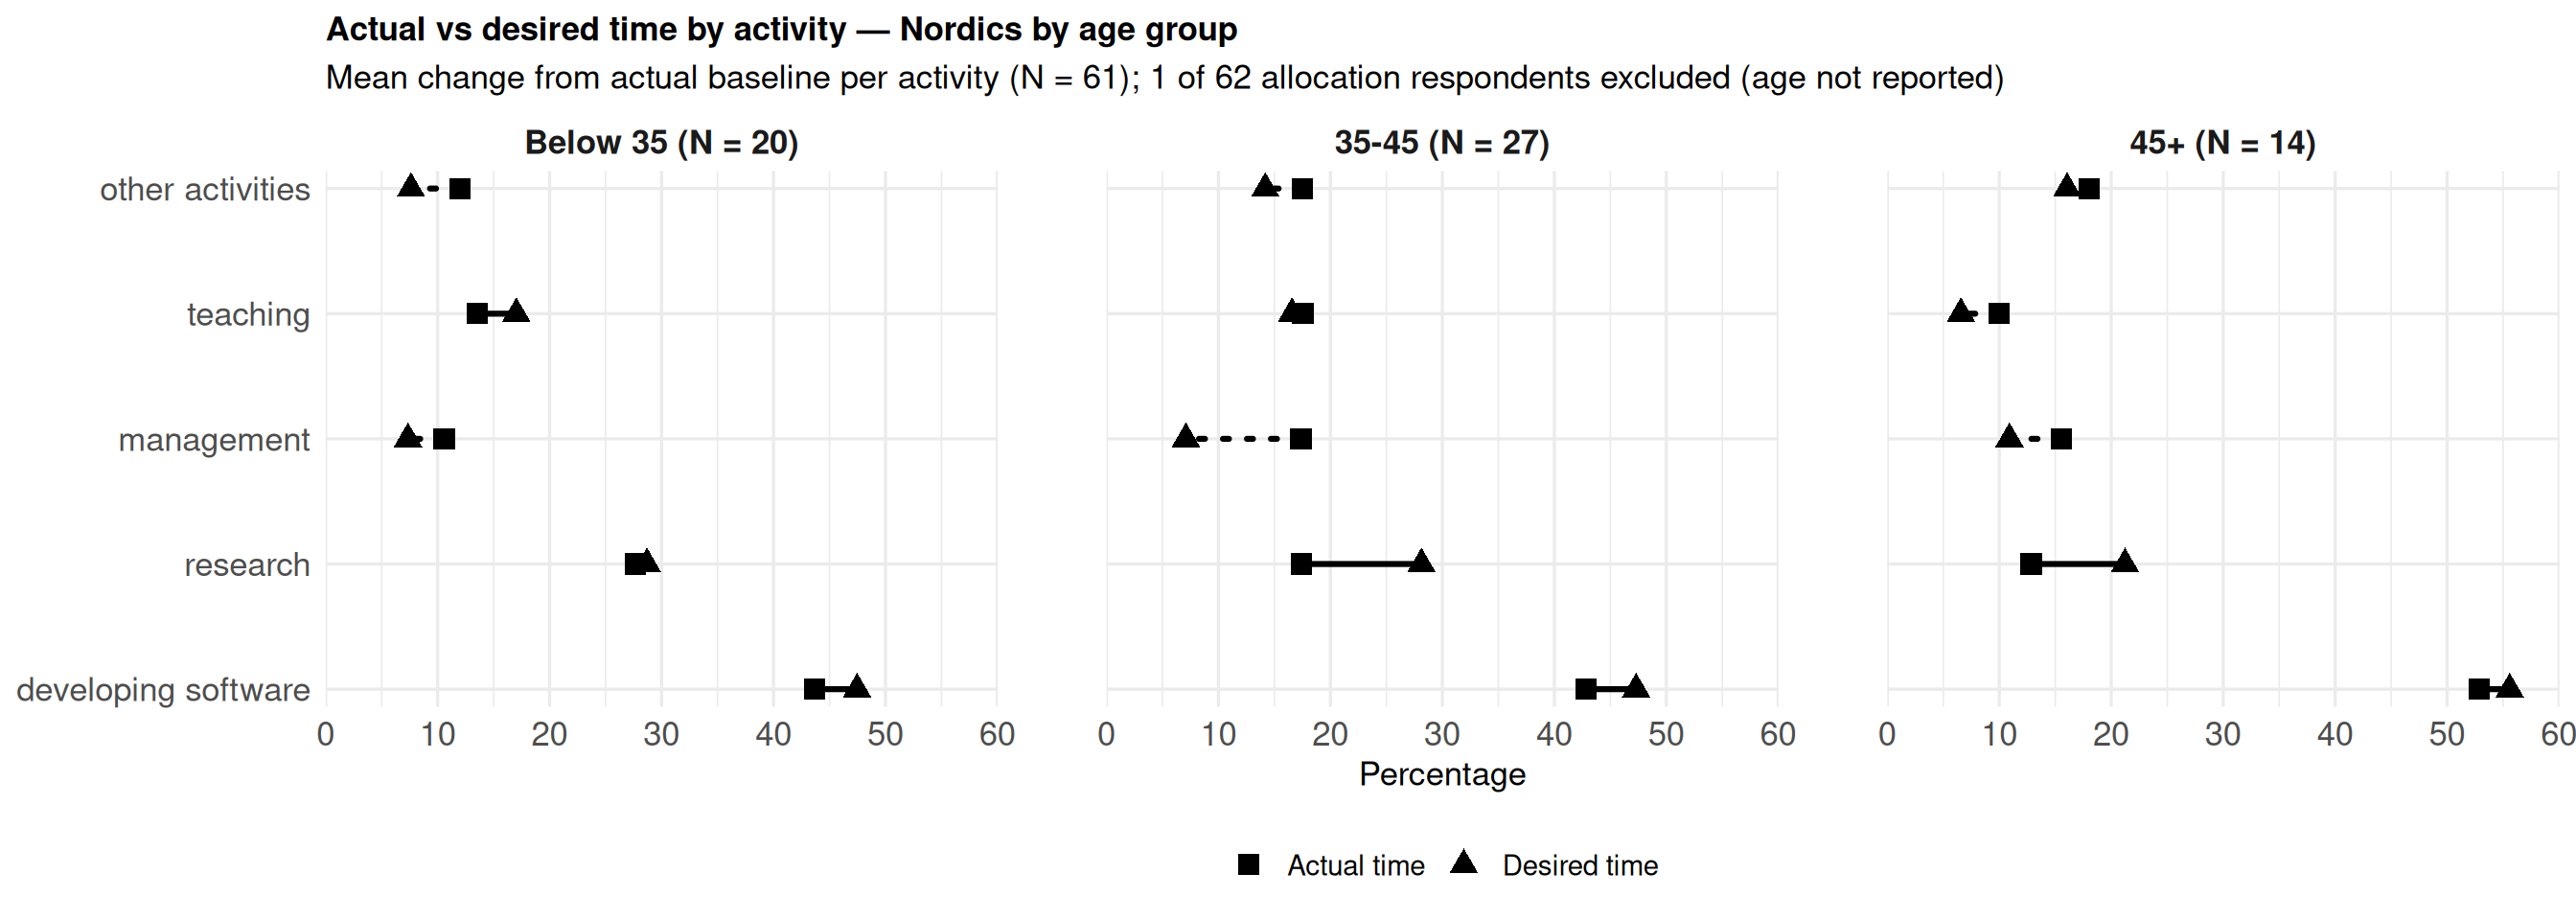
There were some differences by age group. Respondents aged 35-45 and 45+ wanted to reduce teaching time slightly, while respondents under 35 wanted to increase it. This may reflect differences in career stage and responsibilities.
Overall, the results suggest that RSEs see software development and research contribution as the core of their work, while management and other organisational tasks can reduce time available for these activities.
NoteKey finding
RSEs spend most of their time developing software and would like even more time for software development and research, with less time spent on management.
Technical toolbox: Python, GitHub, HPC and collaboration
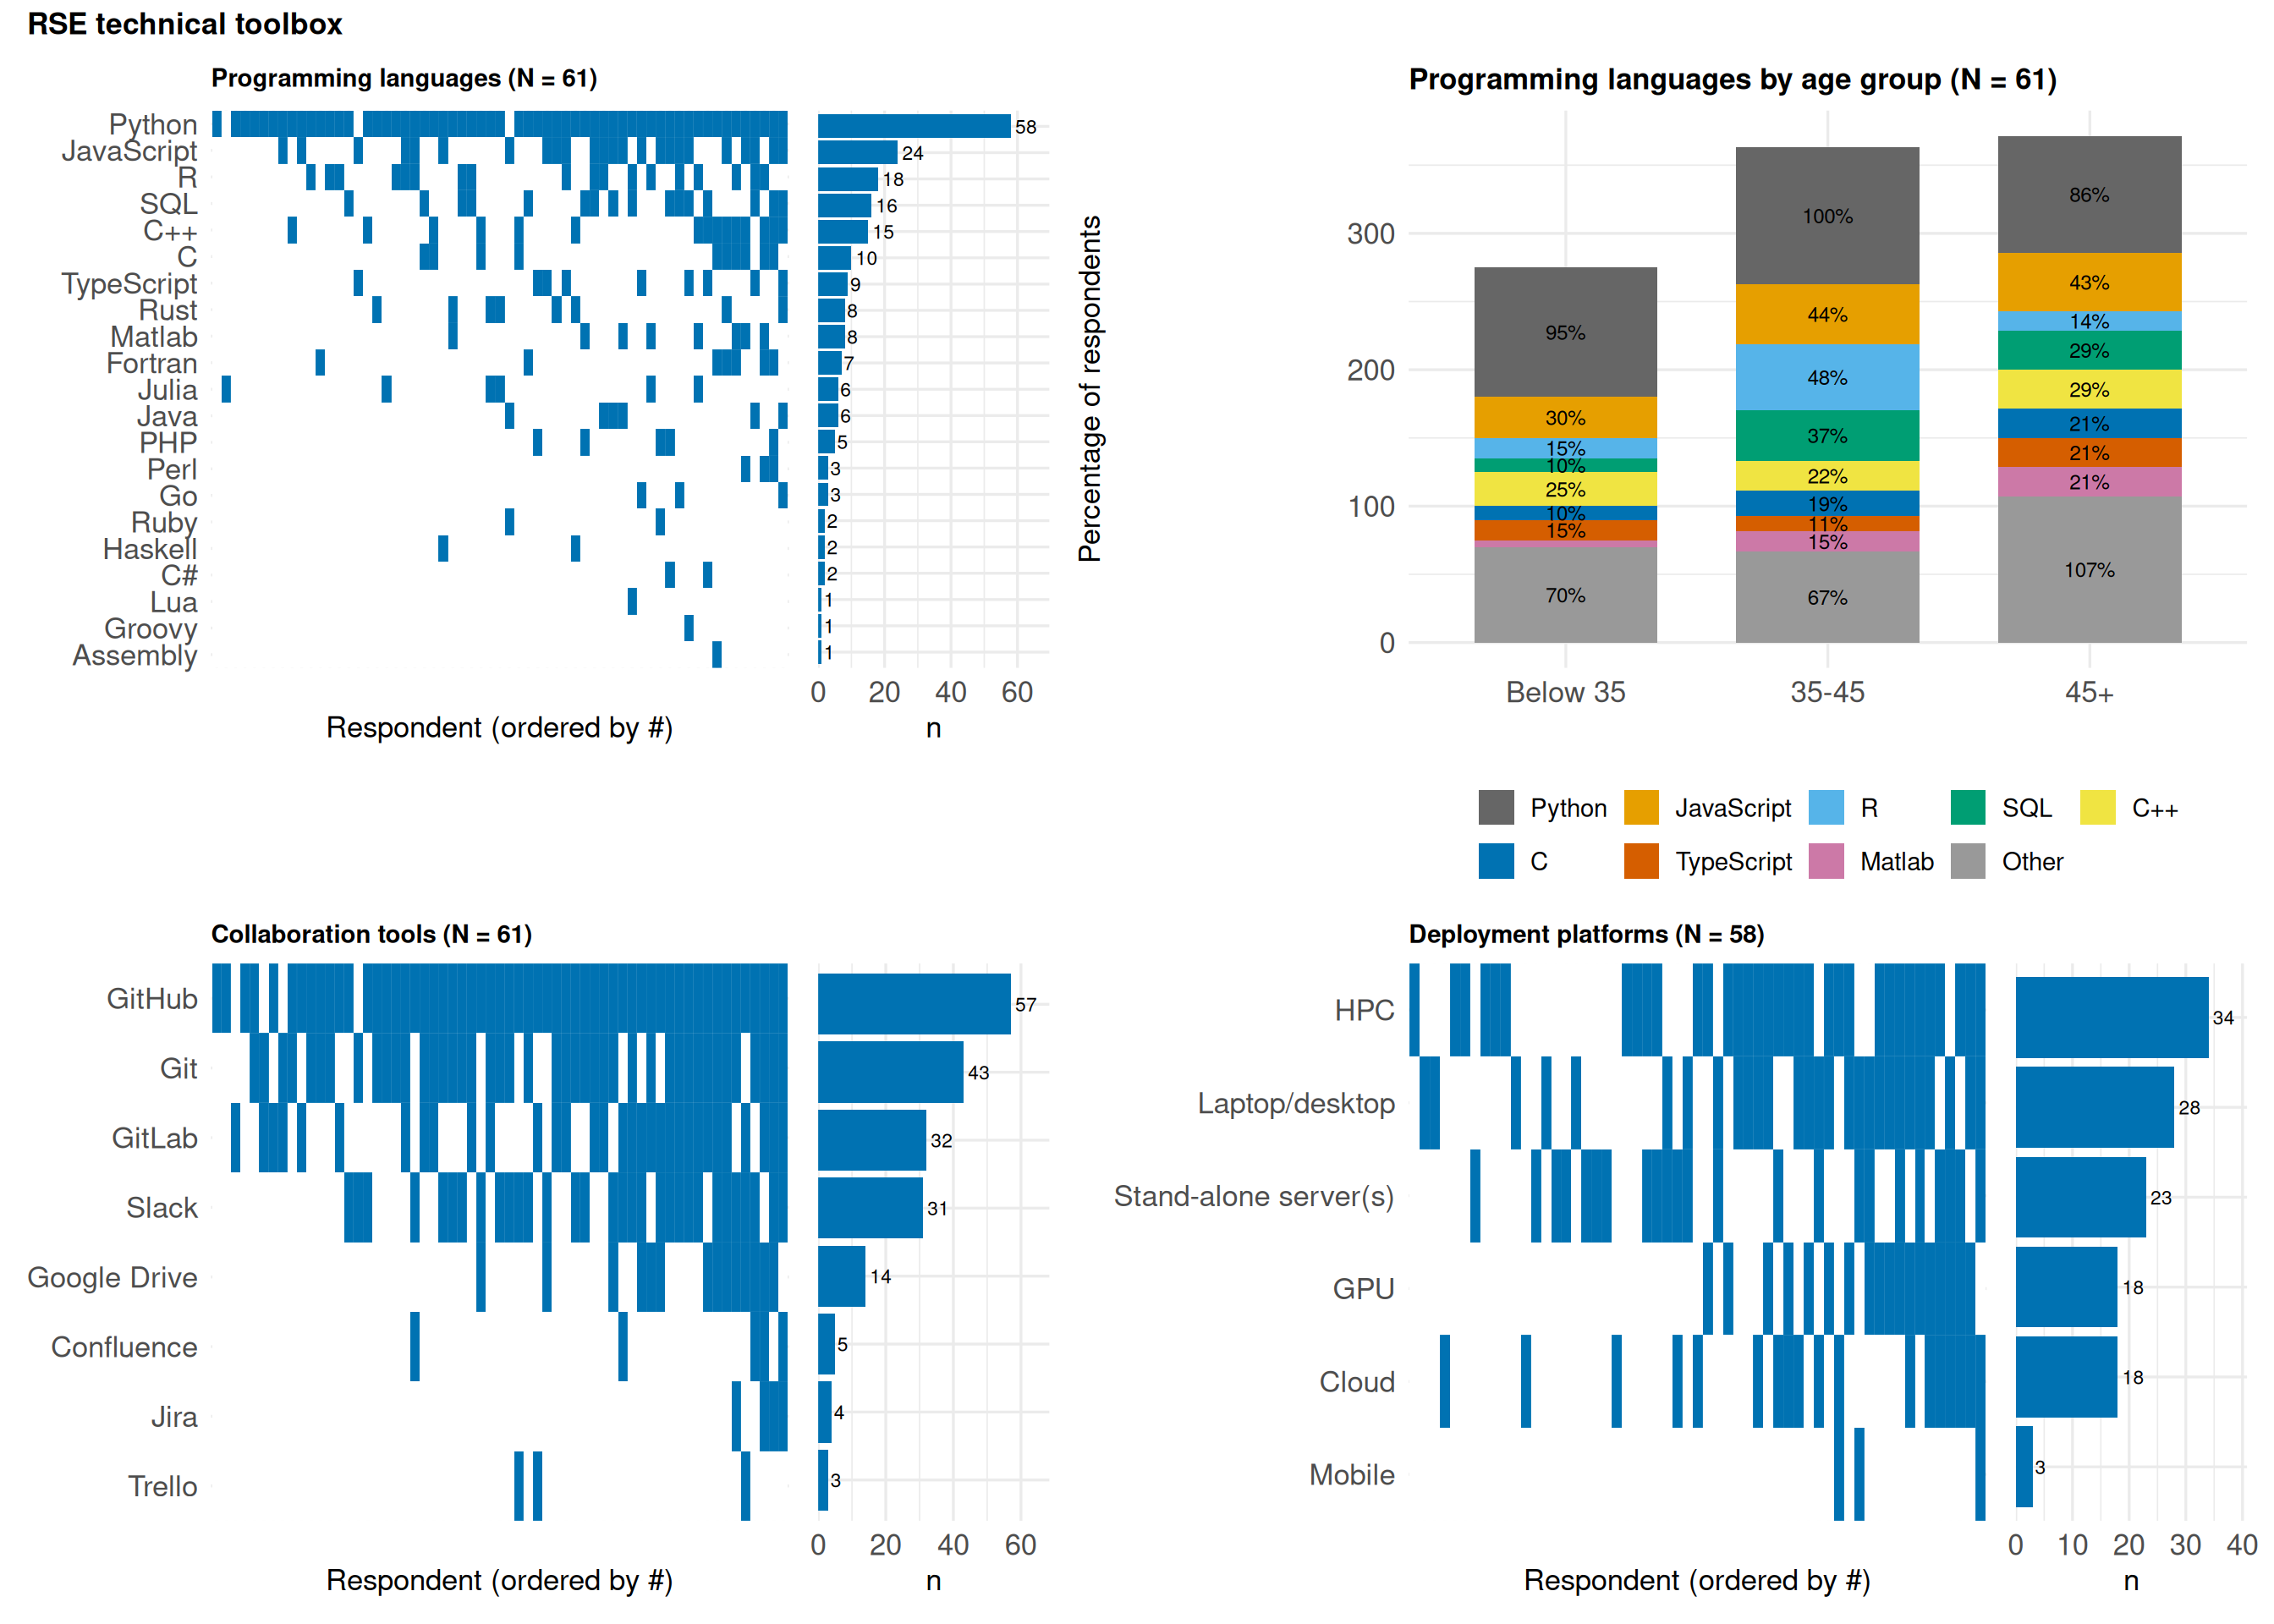
Python is by far the most commonly used programming language among respondents, selected by 95.1%.
Git was reported as a version control tool by all respondents, and GitHub was selected by 93.4% as a collaboration platform for software development. Other frequently selected collaboration tools included Git (70.5%), GitLab (52.5%), and Slack (50.8%).
HPC was the most frequently selected deployment environment, at 58.6%. This was followed by laptops or desktops (48.3%), stand-alone servers (39.7%), and cloud platforms and GPU (31.0%).
For day-to-day development, 73.3% primarily use GNU/Linux, followed by macOS (15.0%) and Windows (10.0%).
There are also some age-group differences in programming language selections. Among respondents aged 45+, the most frequently selected languages after Python were JavaScript at 42.9%, C++ at 28.6%, and SQL at 28.6%. Among those aged 35-45, R was selected by 48.1%, JavaScript by 44.4%, and SQL by 37%. Among respondents under 35, JavaScript was selected by 30%, while C++ and Rust were each selected by 25%.
NoteKey finding
Python, Git, GitHub and HPC are central parts of the Nordic RSE technical toolbox.
Generative AI in RSE work
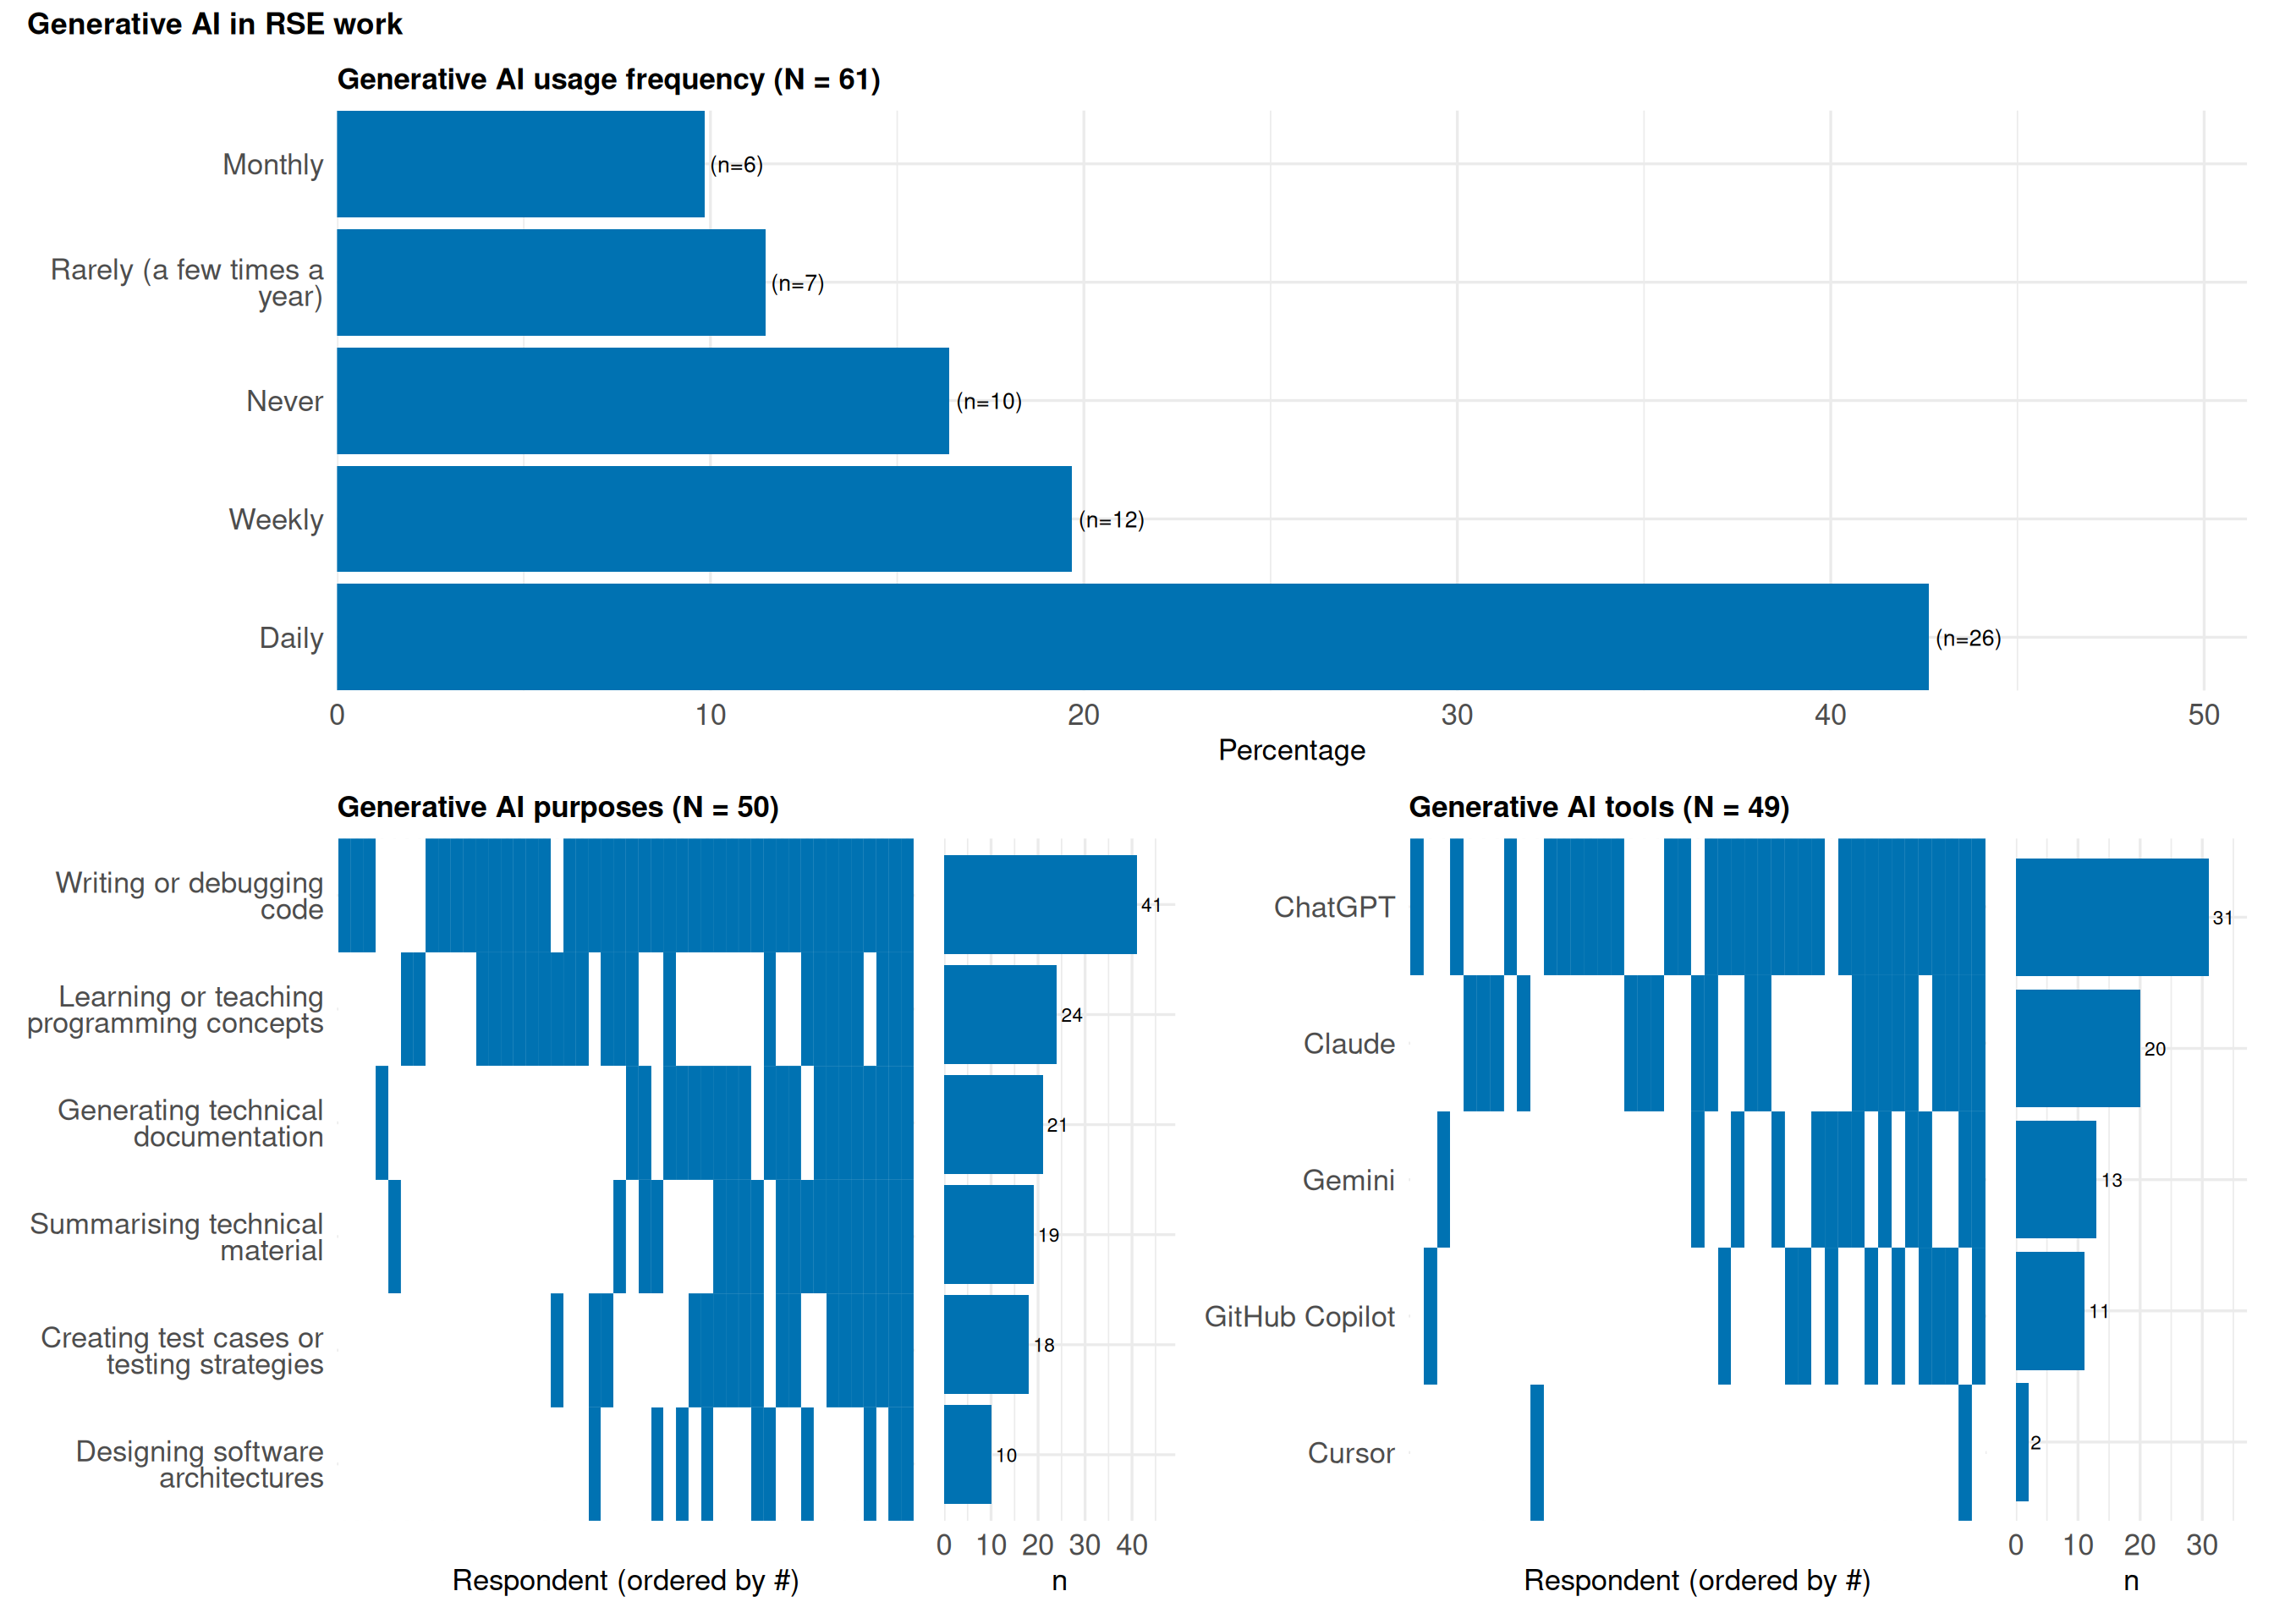
Generative AI tools are already used regularly by many respondents. 42.6% reported daily use in RSE-related tasks, and 19.7% reported weekly use. 16.4% reported never using generative AI in their RSE work.
The most common use case was writing and debugging code, selected by 82.0%. Designing software architecture was the least common use case, at 20.0%. This suggests that generative AI is currently used more for practical coding tasks than for higher-level software design.
Among tools used at work, ChatGPT was selected by 63.3%, followed by Claude (40.8%) and Gemini (26.5%).
Looking ahead, 59.3% expected generative AI not to significantly change demand for RSE roles over the next five years. 22.2% expected demand to increase, while 18.5% expected it to decrease.
Most respondents expected generative AI to increase their own productivity (66.1%). Views on code quality and job satisfaction were more mixed. 44.6% expected code quality to stay the same, while 36.8% expected job satisfaction to decrease.
When asked what skills are needed to use generative AI effectively, common themes included critical thinking, scepticism and output validation; solid software engineering skills; prompt engineering and generative AI literacy; judgment about when and how to use AI; code comprehension; and testing and quality assurance.
NoteKey finding
Generative AI is widely used for writing and debugging code, but software architecture is the least common use case.
Software quality, testing and software citation
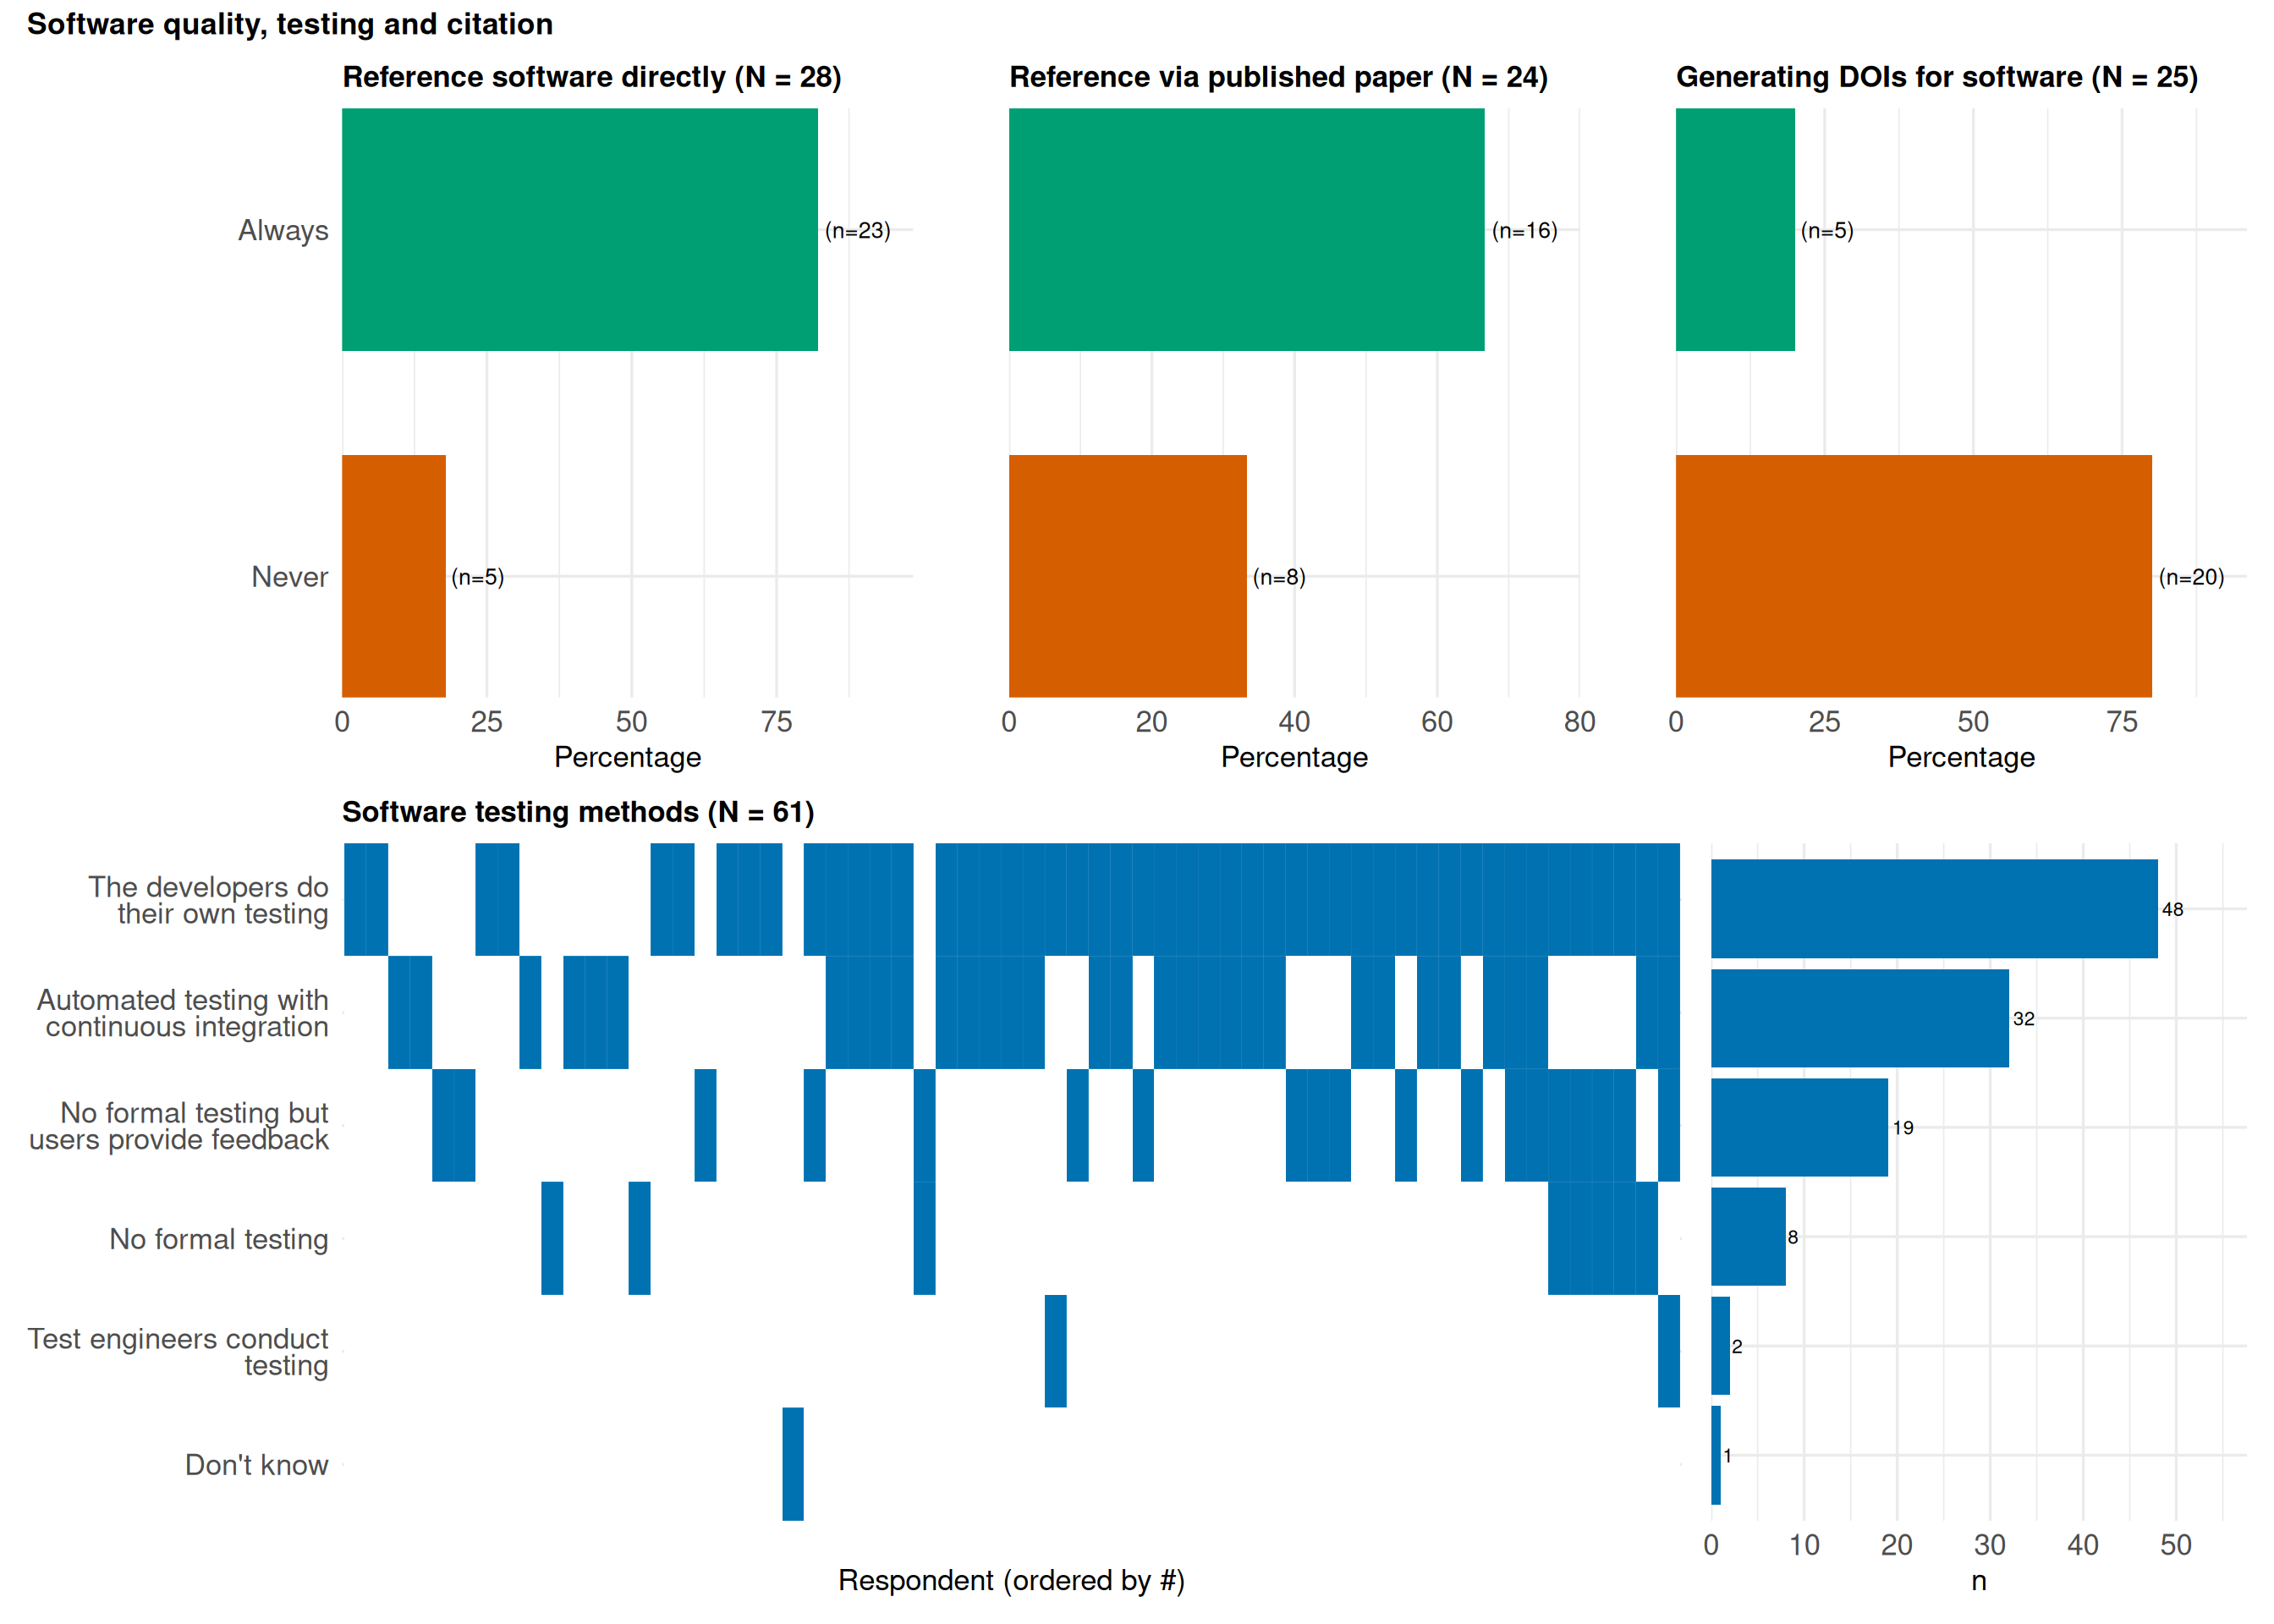
Developer testing was the most common testing approach: 78.7% selected “developers do their own testing”. Automated testing with continuous integration was selected by 52.5%, while 31.1% selected “no formal testing but user feedback”.
Software citation appears to be common among those who answered the citation questions. 82.1% said they always reference software directly and 66.7% said they always reference a published paper describing the software.
Persistent identifiers are less common. 80% of respondents who answered this question said they never generate a DOI or other persistent identifier for their software.
Open-science practices appear widespread: 88.7% reported having an ORCID ID, and 94.9% of those who answered the licensing question said they always license their software with an open-source licence.
NoteKey finding
Testing and software citation are common among respondents, but generating persistent identifiers such as DOIs is less common.
Job satisfaction and labour market demand
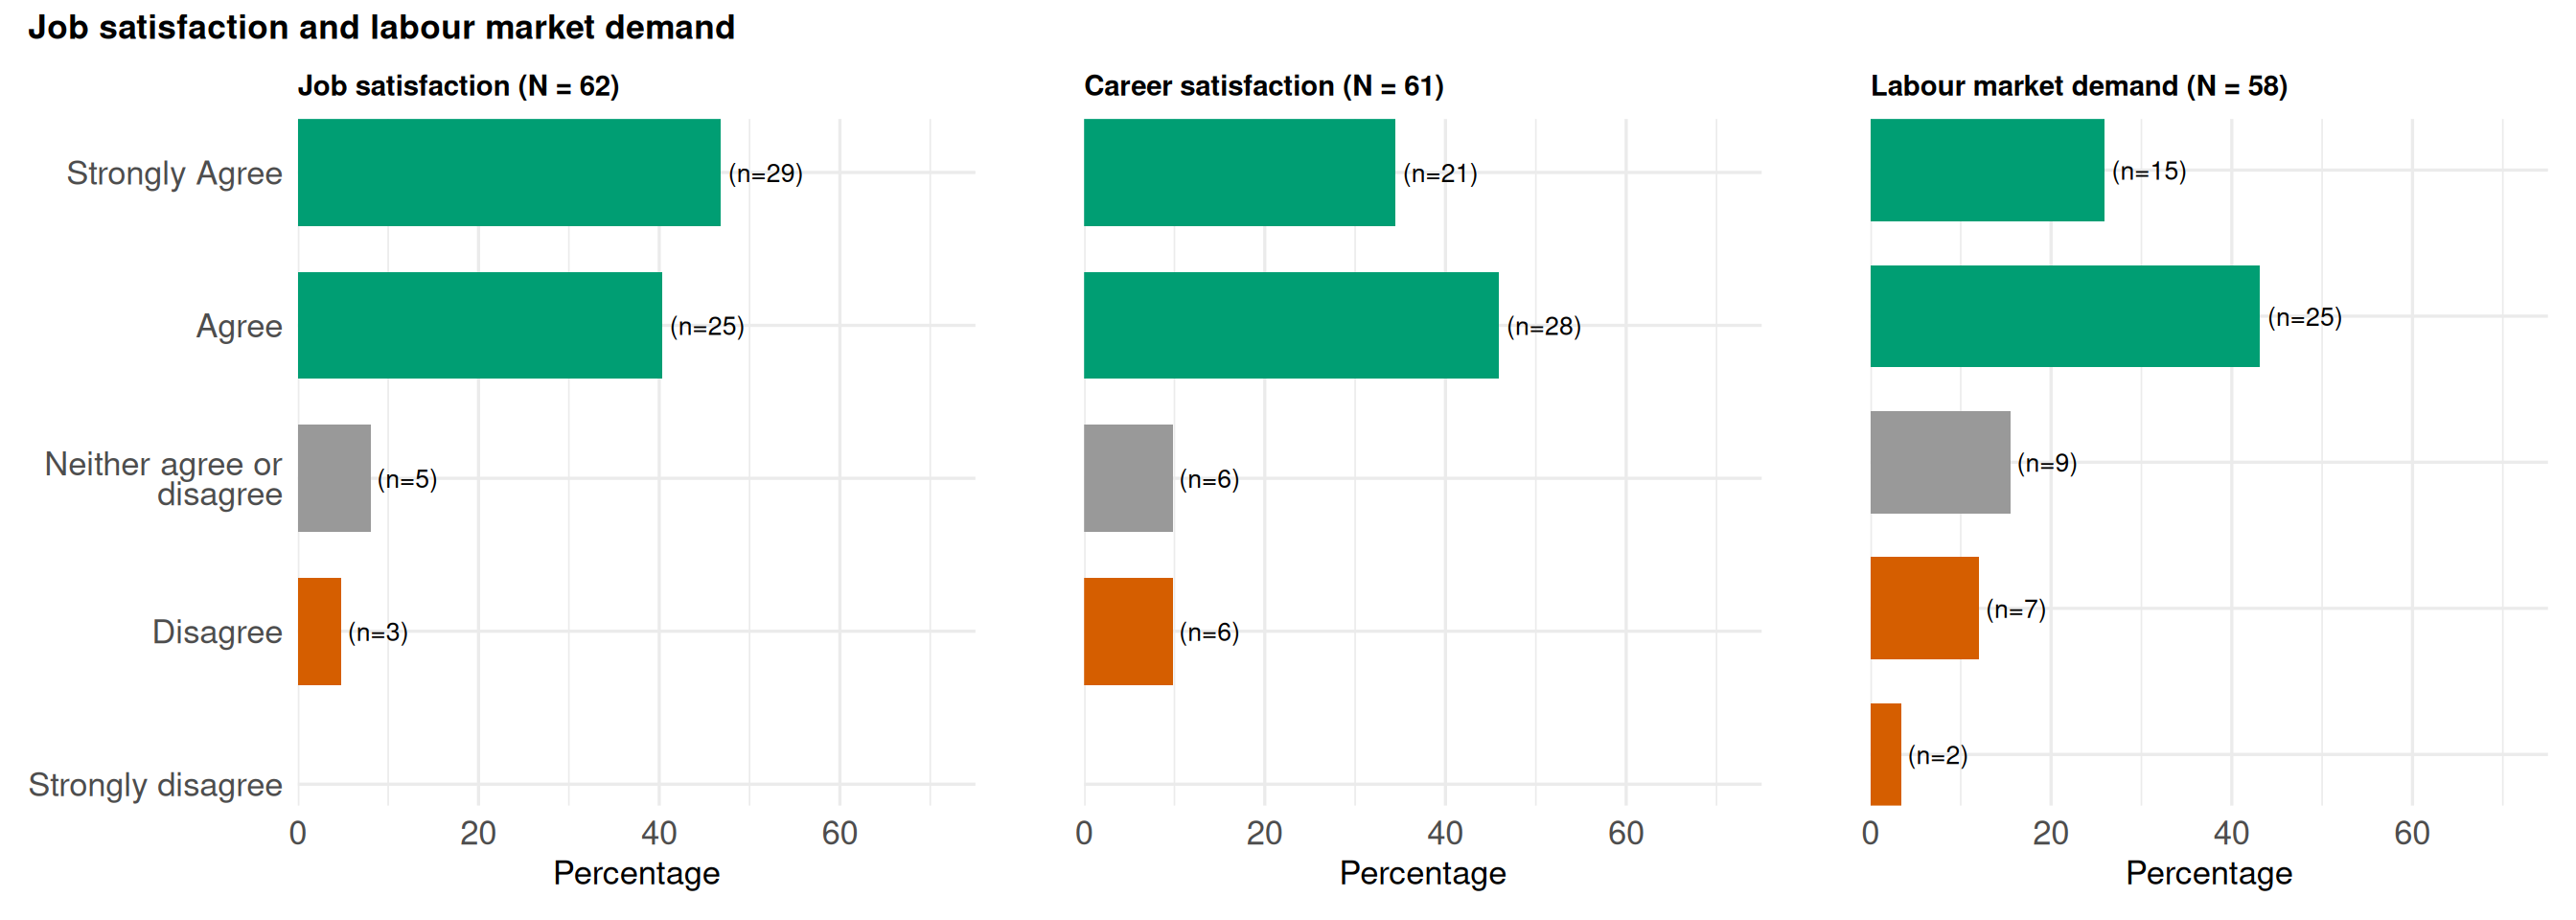
Respondents reported high levels of satisfaction. 87.1% were satisfied with their current job position, while 4.8% were unsatisfied. Career satisfaction was also high: 80.3% were satisfied and 9.8% were unsatisfied.
Many respondents also saw their expertise as relevant beyond their current workplace. 69.0% agreed that their experience is in demand on the labour market, compared with 15.5% who disagreed. This confidence appears across age groups, and is especially strong among respondents aged 45+, where 83.3% agreed that their experience is in demand. Among those under 35, 73.7% agreed, and among those aged 35-45, 57.7% agreed while 19.2% disagreed.
Recognition of research contribution was stronger from supervisors than from institutions. 81.4% agreed that their contribution is recognised by their supervisor, compared with 61.0% who agreed that it is recognised by their institution.
NoteKey finding
Most respondents are satisfied with their jobs and careers, and many feel their experience is in demand. Recognition from supervisors is reported more strongly than recognition from institutions.
Career progression and promotion uncertainty
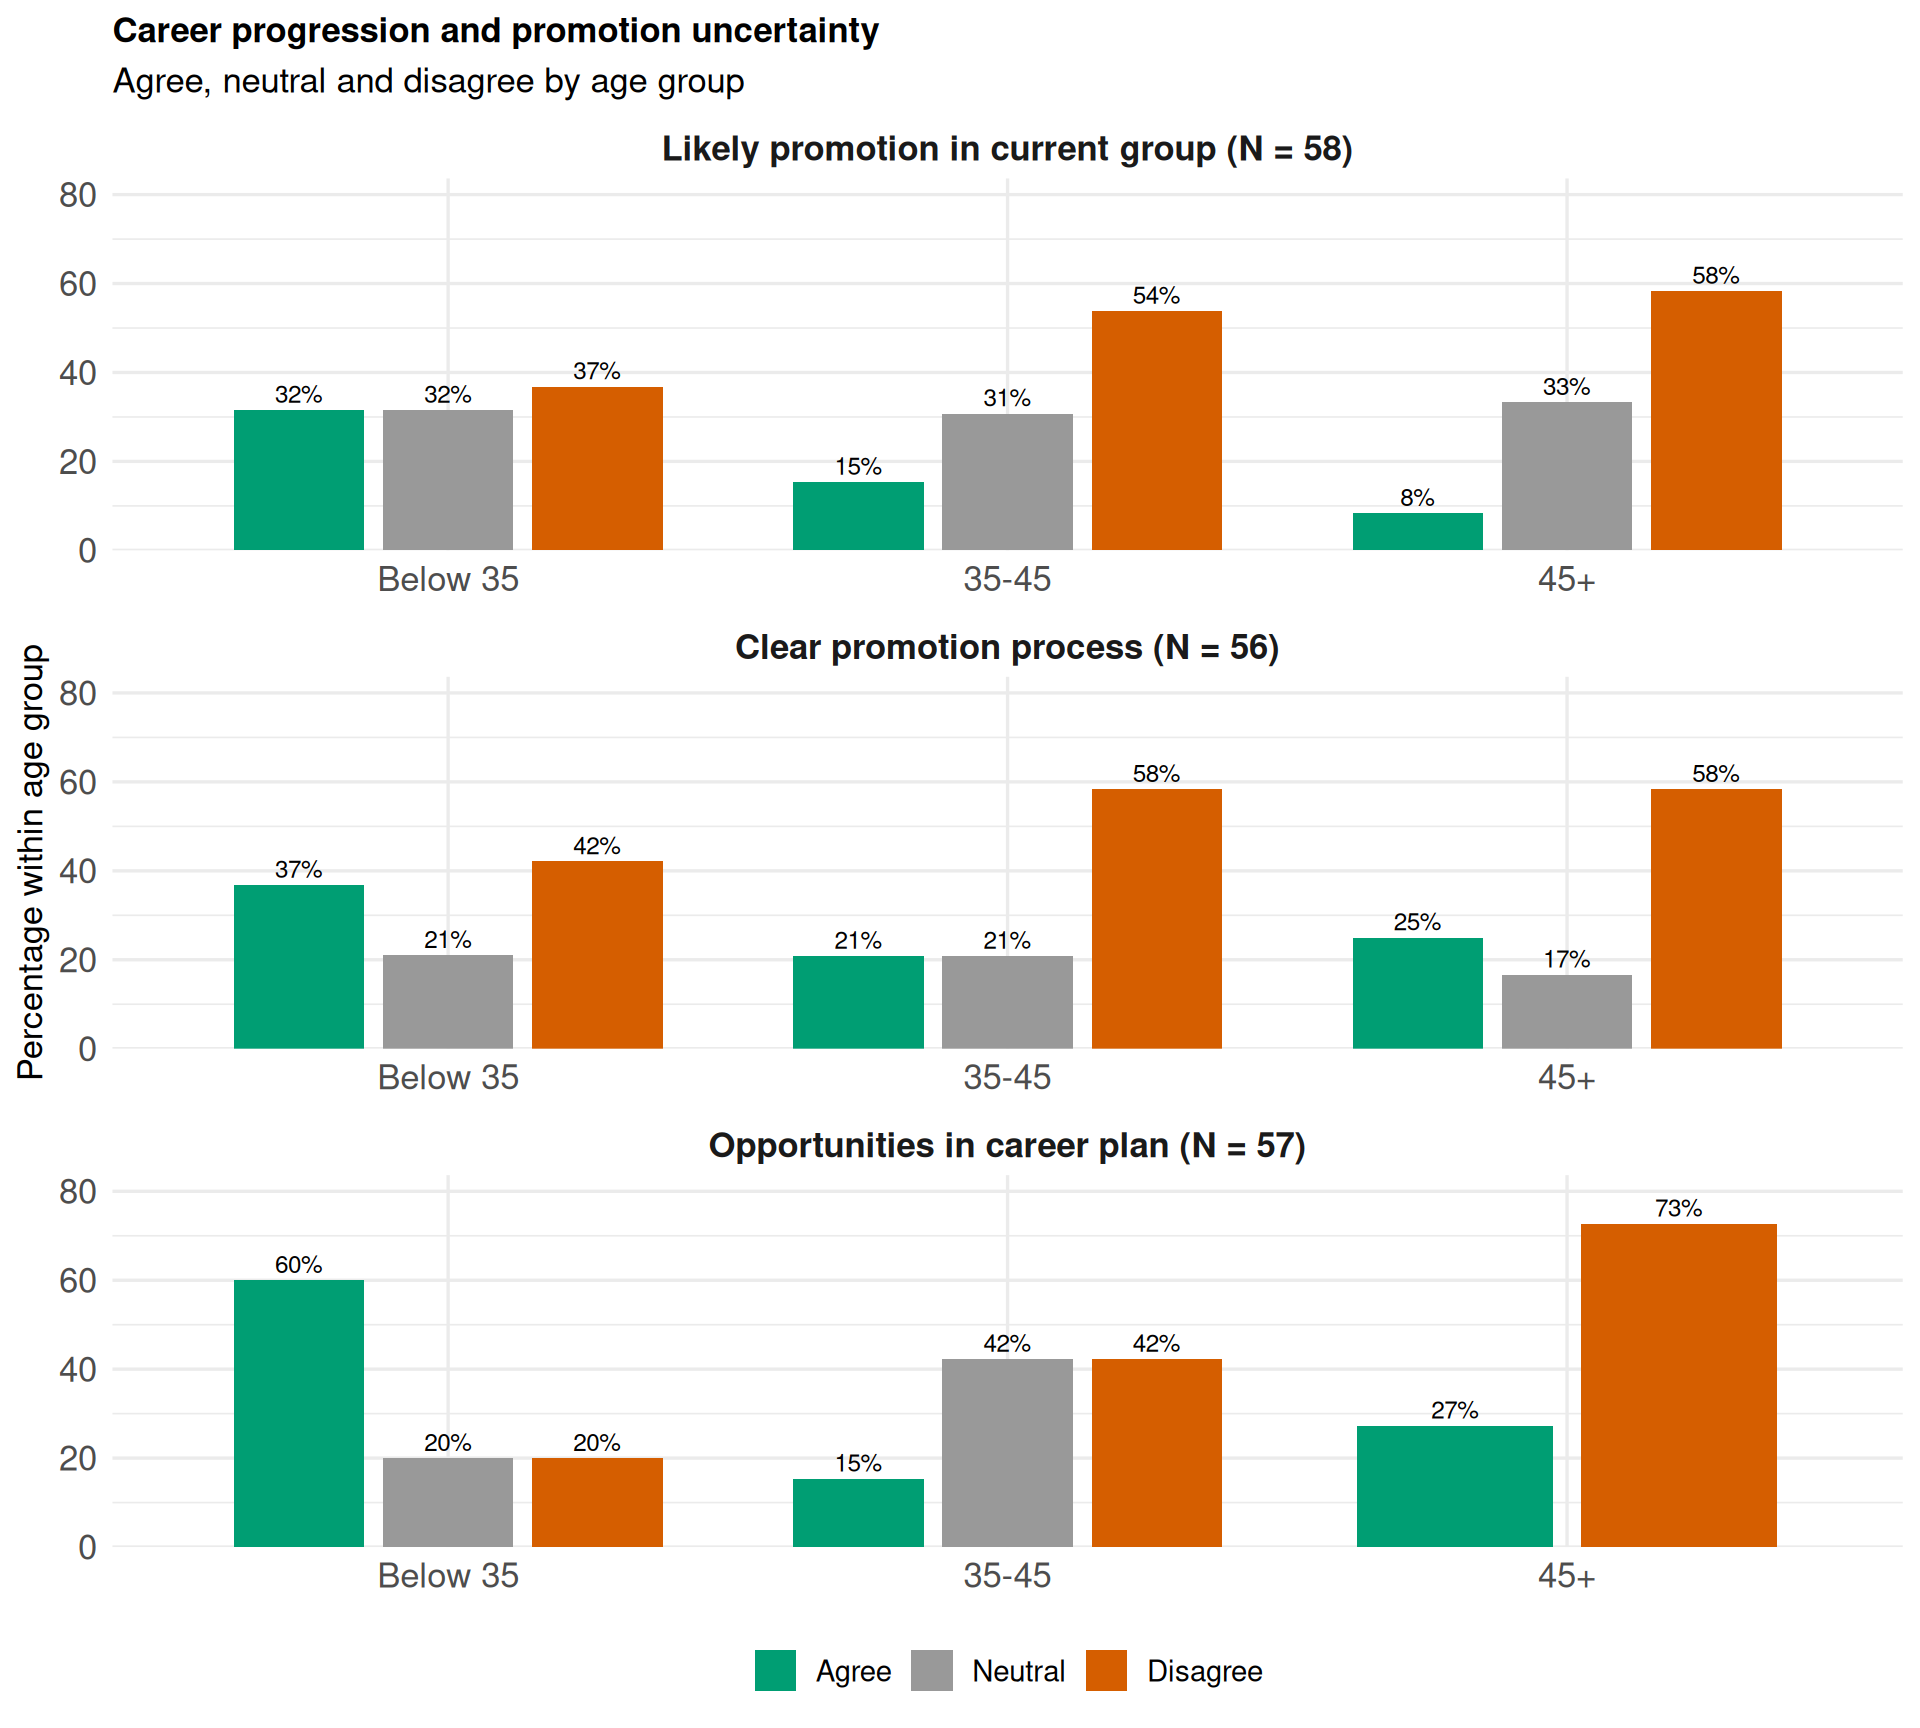
Although many respondents are satisfied and feel that their skills are in demand, career progression within current roles appears less clear.
Overall, 48.3% disagreed that they are likely to gain a promotion within their current group, while 20.7% agreed. The pattern was stronger among older respondents: among those aged 45+, 58.3% disagreed and only 8.3% agreed.
Promotion processes also appear unclear. 51.8% disagreed that the process for gaining a promotion is clear and understandable, compared with 28.6% who agreed.
Younger respondents were generally more positive about career opportunities. Among those under 35, 60.0% agreed that there are many opportunities within their chosen career plan. Among respondents aged 45+, 72.7% disagreed.
This age pattern should be interpreted carefully. For younger respondents, especially those in PhD positions, the next career step may be more clearly defined. For mid-career and senior RSEs, progression may be less standardised, especially where institutions do not have formal RSE career paths.
At the same time, 43.9% agreed that their next position is likely to be an RSE or Research Software Developer role. This suggests that many still see themselves continuing in the field, even when promotion routes are unclear.
NoteKey finding
Promotion routes are often unclear, especially beyond early-career stages.
Skills development and training needs
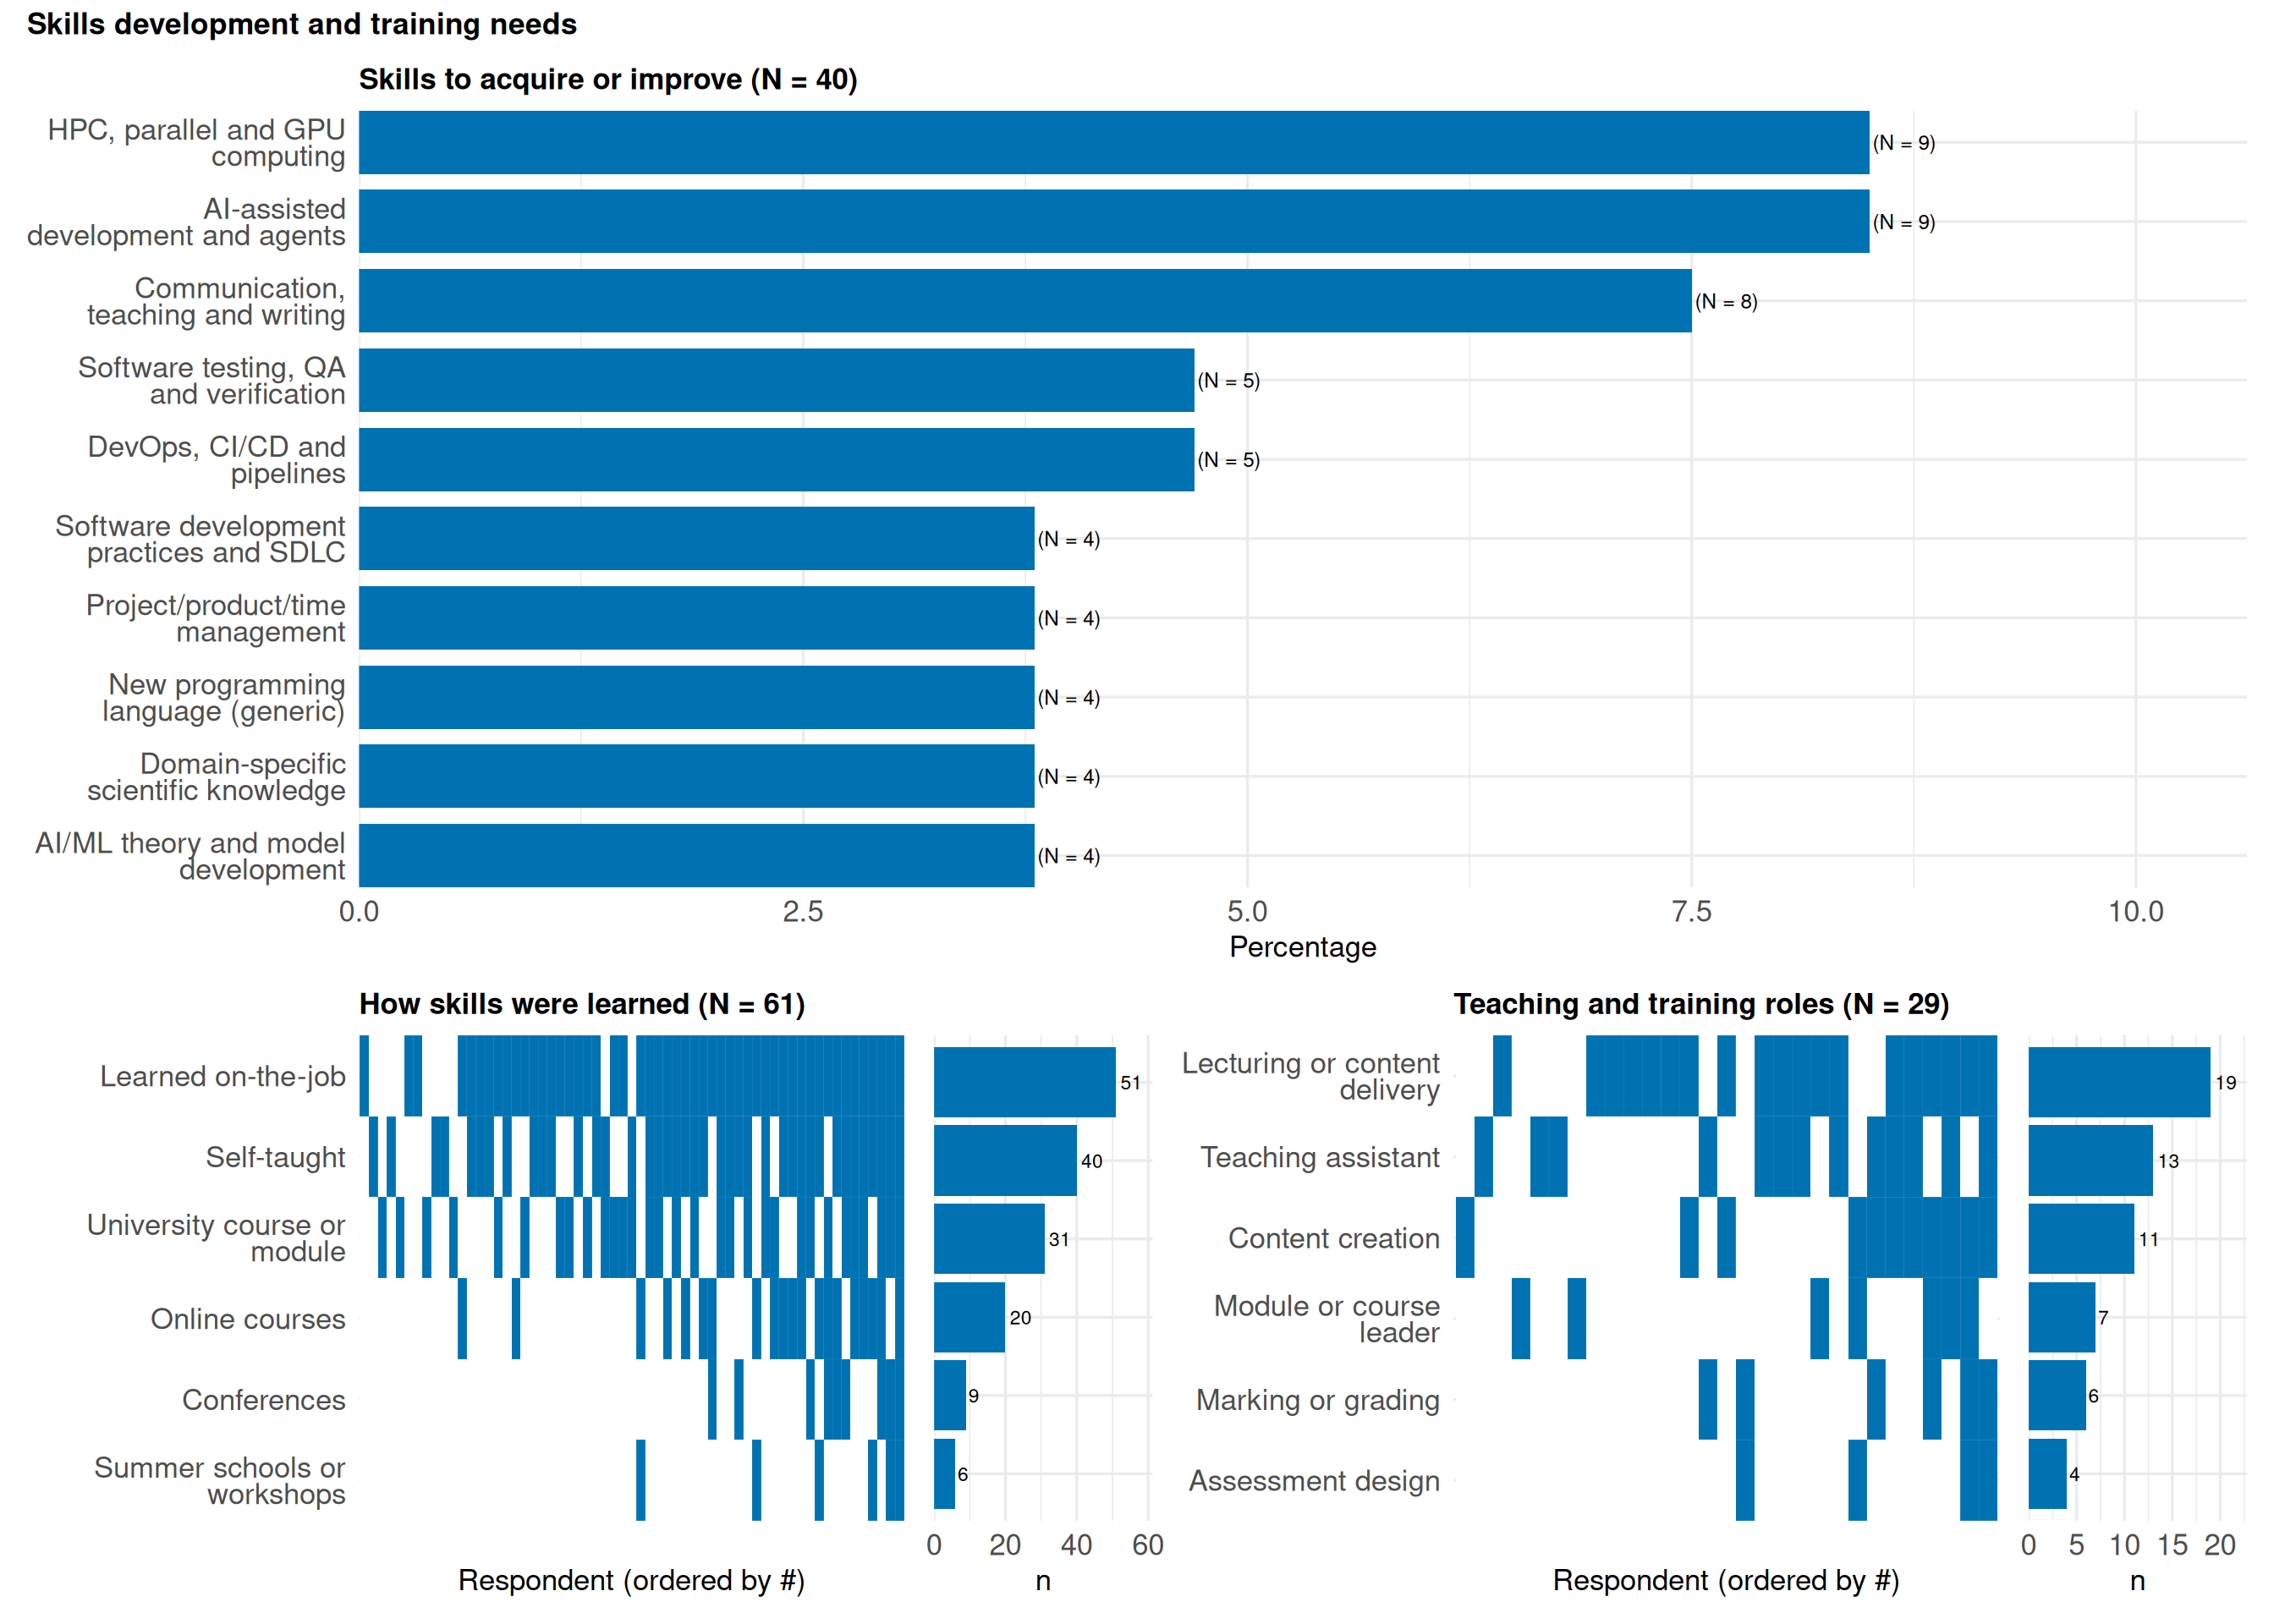
Most respondents learned the skills they need for RSE work through practice. 83.6% selected learning on the job, and 65.6% selected self-taught learning. A university course or module was selected by 50.8%, and online courses by 32.8%.
The most common future skill interests were AI-assisted development and agents” (22.5%), HPC, parallel and GPU computing (22.5%), communication, teaching and writing (20.0%), DevOps, CI/CD and pipelines (12.5%), and software testing, quality assirance and verification (12.5%).
Many respondents are also involved in teaching or training. 47.5% reported providing training one to two times per year, and 50.9% teach or support credit-bearing modules or courses.
Time for personal skills development varies. 38.3% said they always have some time for their own skills development, while 28.3% said they have time only in weeks with a low workload.
NoteKey finding
Most RSEs learned their skills through practice and self-study. Future skills interests include AI-assisted development, HPC, DevOps, testing and communication.
Networks, community and local support structures
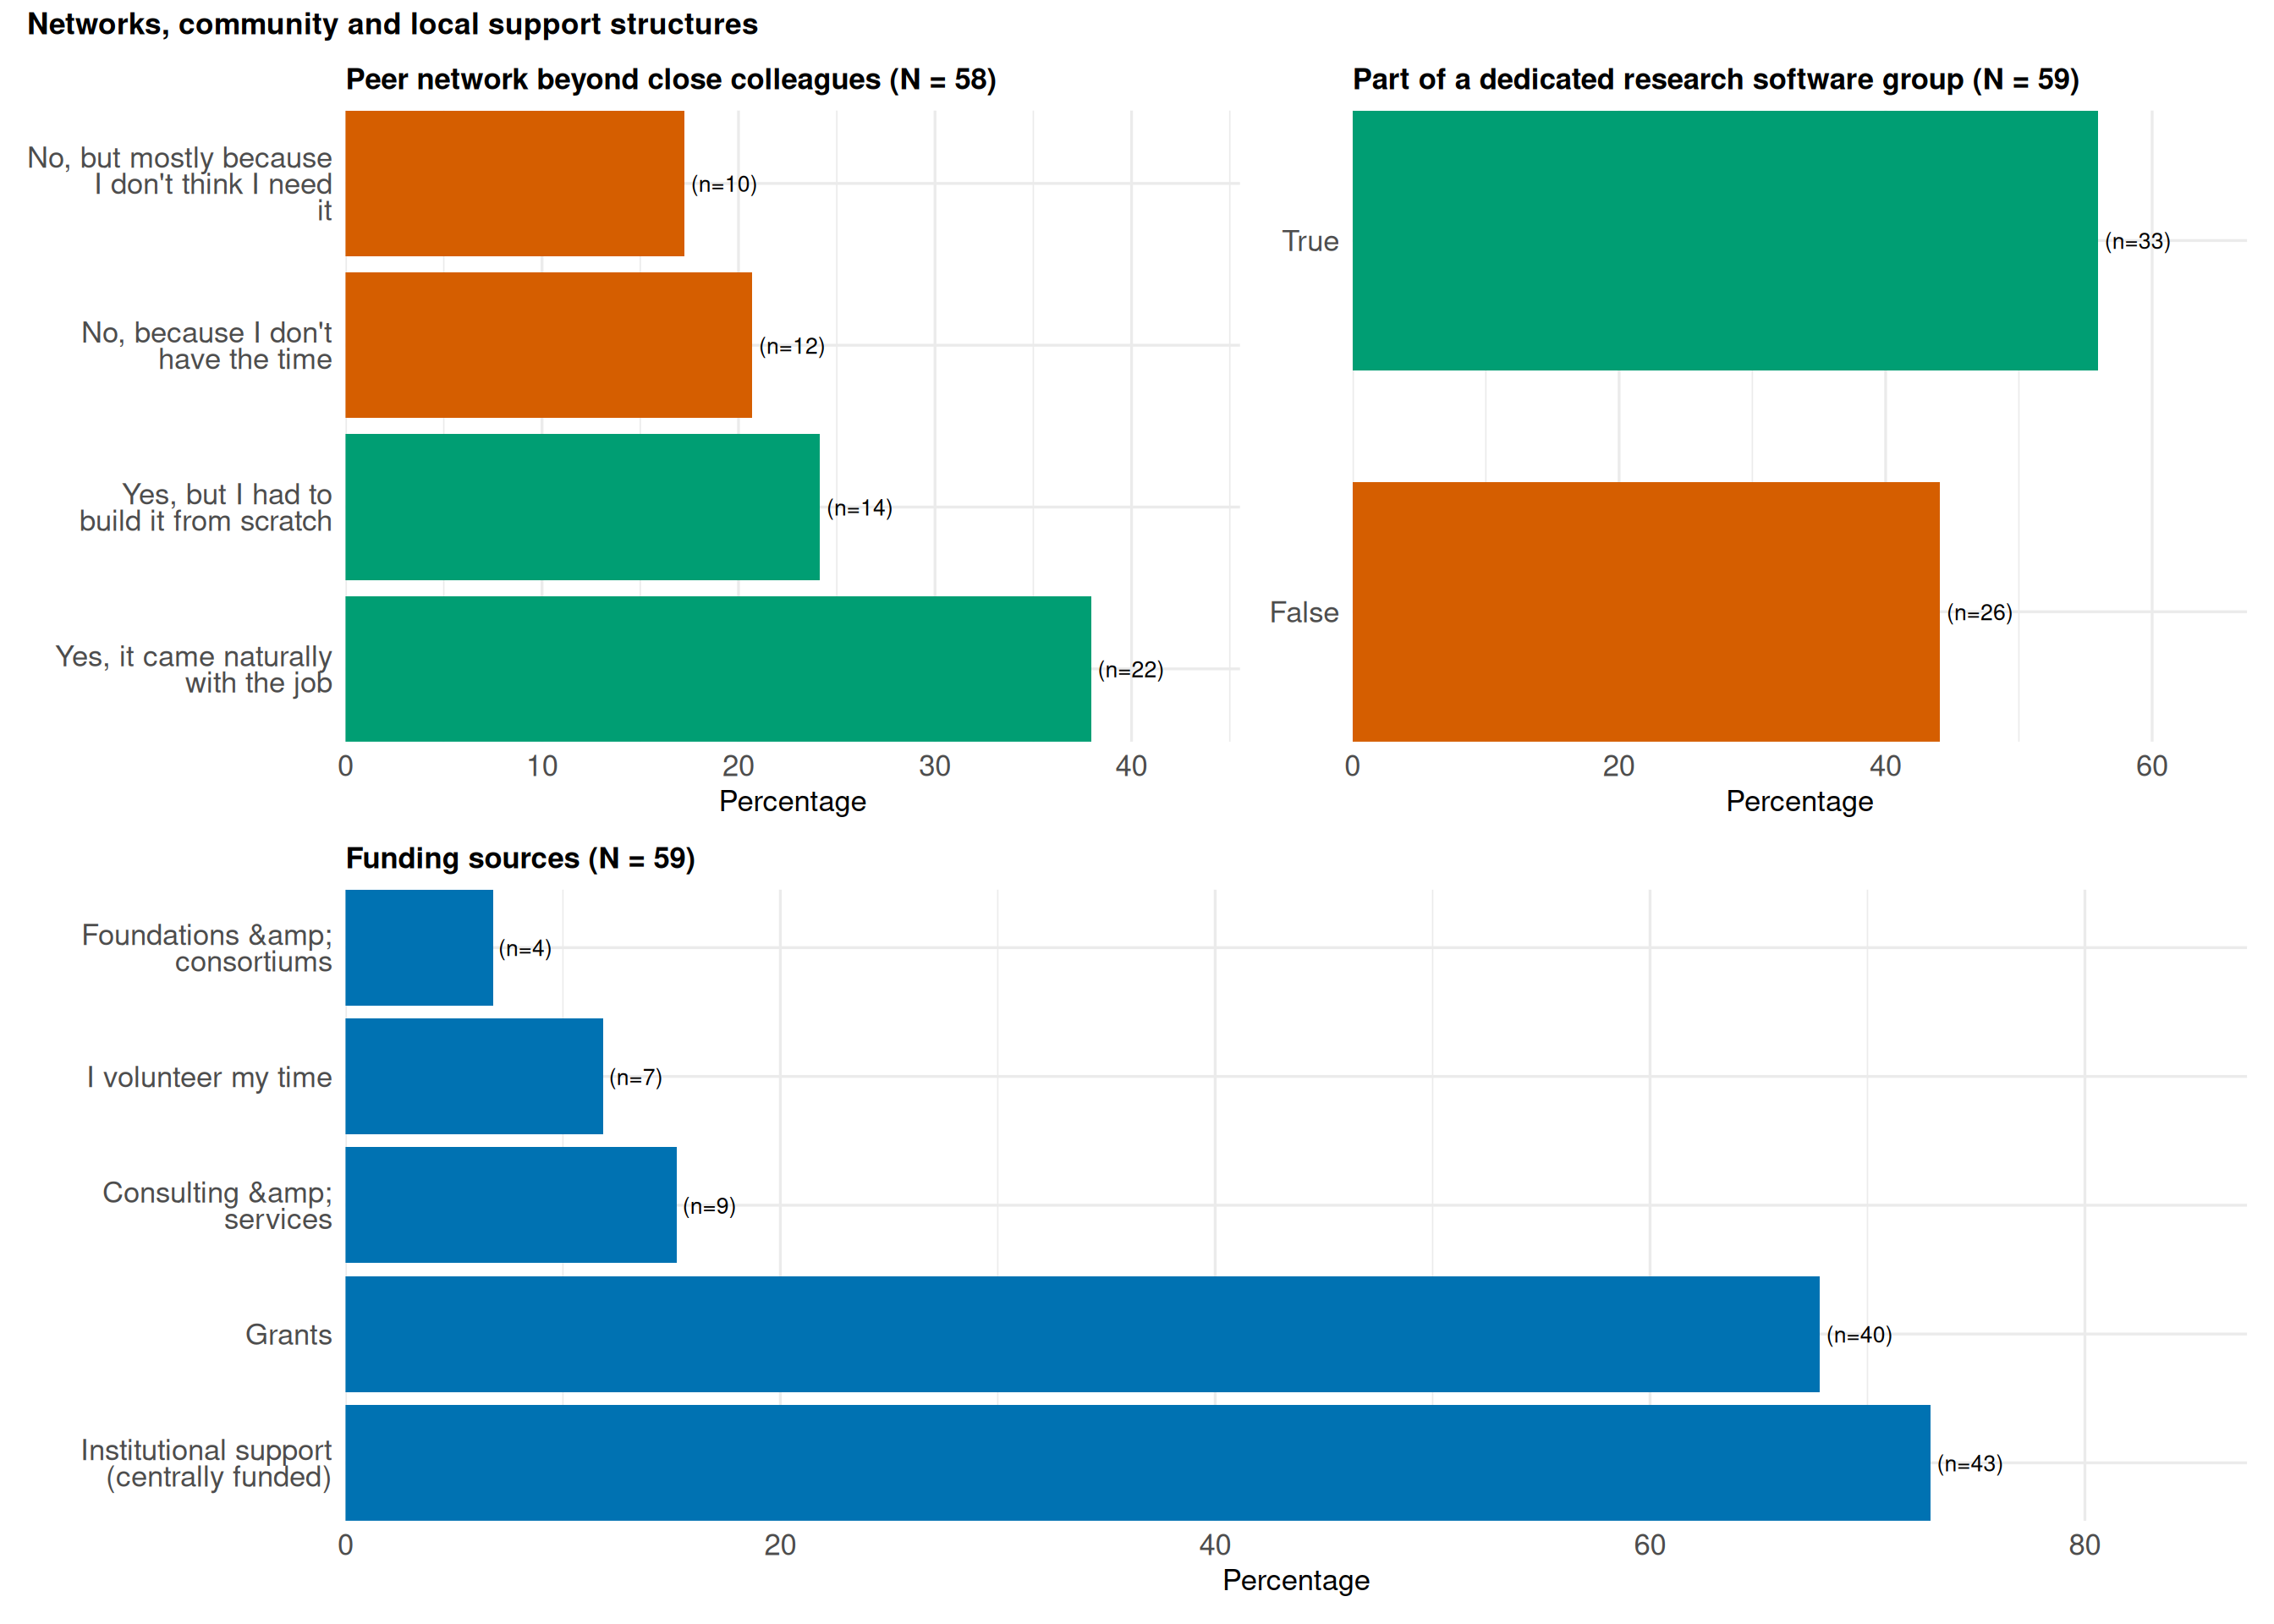
Many respondents have peer networks beyond their closest colleagues. 62.0% reported having such a network, including 24.1% who had to build it from scratch.
A majority, 55.9%, reported being part of a dedicated research software group within their organisation. This suggests that Nordic RSEs already have local structures for support and collaboration.
44.1% are members of an RSE association. Among respondents who answered the follow-up question about interest in joining an RSE organisation, 78.6% said they would be interested.
The main things respondents hoped to get from such an organisation were networking (85.1%), research software standards (72.3%), training (57.4%), and research collaborations (53.2%). Priorities varied by age: respondents under 35 emphasised job opportunities (66.7%), while those aged 45+ placed more weight on research collaborations (63.6%).
Funding sources show a mix of institutional and project-based support. Institutional support was selected by 72.9% and grants by 67.8%. Access to dedicated RSE funding appears limited: only 16.7% said they have access to RSE-type grants in their institution or country, while 40.0% said no and 43.3% did not know.
NoteKey finding
Many RSEs have peer networks and local research software groups, but broader community structures could help with networking, standards, training, and collaboration.
Publications, dissemination and conferences
51.6% of respondents have published a paper about their software, for example in journals such as JOSS or SoftwareX.
When software contributes to a paper, acknowledgement practices vary. Being named as a co-author is relatively common: 25.8% said this always happens and 54.8% said it happens sometimes. Being named as main author is much less common: 2.9% said this always happens, while 64.7% said it never happens.
47.4% have presented software work at a conference or workshop. Commonly mentioned areas included digital humanities, HPC and e-infrastructure, chemistry and materials science, astronomy and physics, and RSE community conferences.
NoteKey finding
Many Nordic RSEs publish and present their software, but authorship and acknowledgement practices vary.
Project workload and resilience
RSE workloads often include several projects. 80.3% of respondents are currently involved in one to four software projects, and 39.7% work on projects that typically include a project manager.
Project resilience appears to be a concern. 58.9% said their current project would stall if just one knowledgeable developer left. Only, 16.9% work on projects that typically have a plan for how to cope with developers leaving.
NoteKey finding
Many projects depend on a small number of knowledgeable developers, and relatively few have succession or departure plans in place.
What respondents want from a Nordic-RSE institute
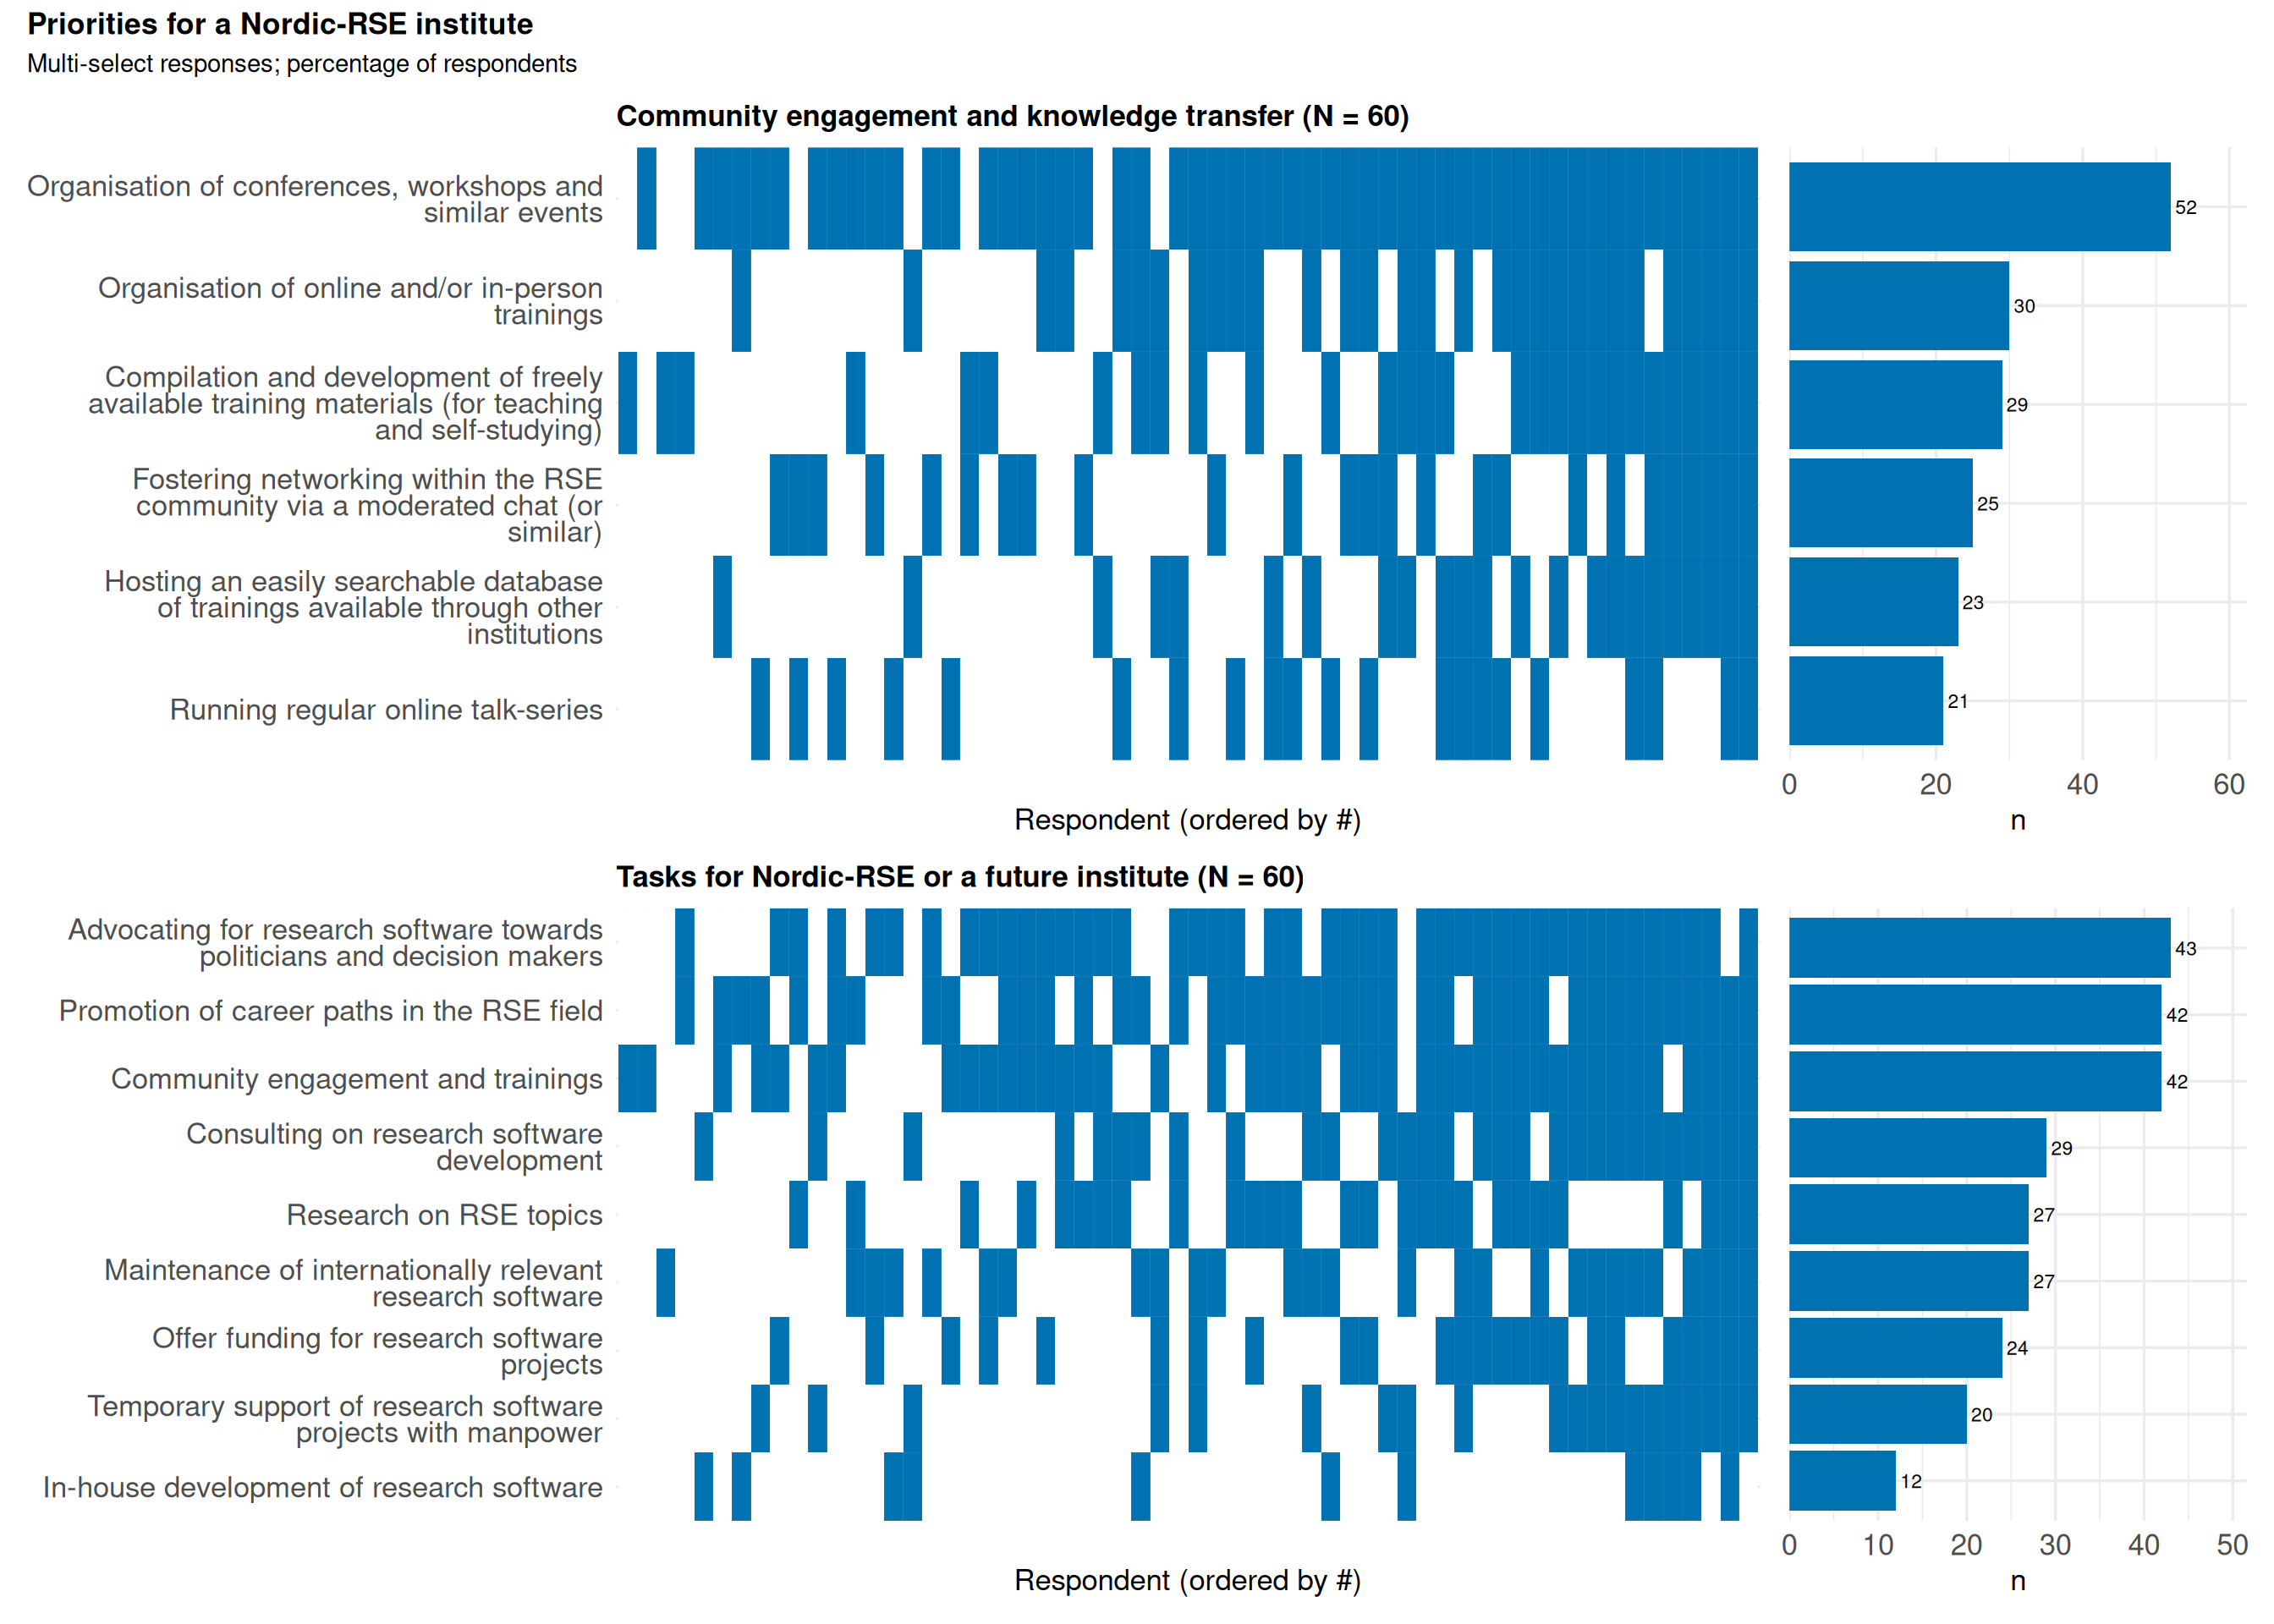
Respondents were also asked how Nordic-RSE could support community engagement and knowledge transfer. The most common answer was organising conferences, workshops, and similar events, selected by 86.7%.
When asked what tasks a Nordic-RSE institute should take on, respondents most often selected advocacy for research software towards politicians and decision makers (71.7%), community engagement and training (70.0%), and promotion of RSE career paths (70.0%).
These priorities fit well with the broader survey findings. Respondents are skilled, often satisfied, and feel that their expertise is in demand. At the same time, they want clearer career structures and more opportunities to learn, connect, and be represented.
NoteKey finding
Respondents see a Nordic-RSE institute mainly as a platform for events, advocacy, career development, and community training.
What’s next
These findings will directly shape how we, together with you at Nordic-RSE develop our activities and priorities going forward. We’ll follow up with a separate post on the concrete steps we’re taking in response. We will also link to resources on where to find training, networking and career that already exist for RSEs in the Nordics today. If you would like to get involved, come to one of our coffee breaks or biweekly meetings: https://nordic-rse.org/join/