26 Actual and desired time spent on activities
26.0.1 Survey question and tasks
- Actual: On average, how much of your time is spent on
- Desired: On average, how much time would you like to spend on
Tasks included: - developing software? - research? - management? - teaching? - other activities?
26.1 Nordics
26.1.1 Descriptive Statistics
| Time allocation (Nordics) | |||
| Mean percentages by activity | |||
| Activity | Actual (%) | Desired (%) | Desired - actual |
|---|---|---|---|
| developing software | 44.7 | 48.5 | 3.8 |
| research | 19.9 | 27.3 | 7.4 |
| management | 14.4 | 7.8 | −6.6 |
| teaching | 14.9 | 14.9 | 0.0 |
| other activities | 15.6 | 12.3 | −3.2 |
For each activity, the chart shows actual time as the baseline (black square) and the corresponding desired level (black triangle) after rescaling each respondent to 100% and computing desired − actual. Lines always run from the actual baseline to actual + change; solid lines indicate an increase, dotted lines a decrease.
Warning in ggplot2::geom_point(data = points_df, ggplot2::aes(x = .data$pct, :
Ignoring unknown parameters: `linewidth`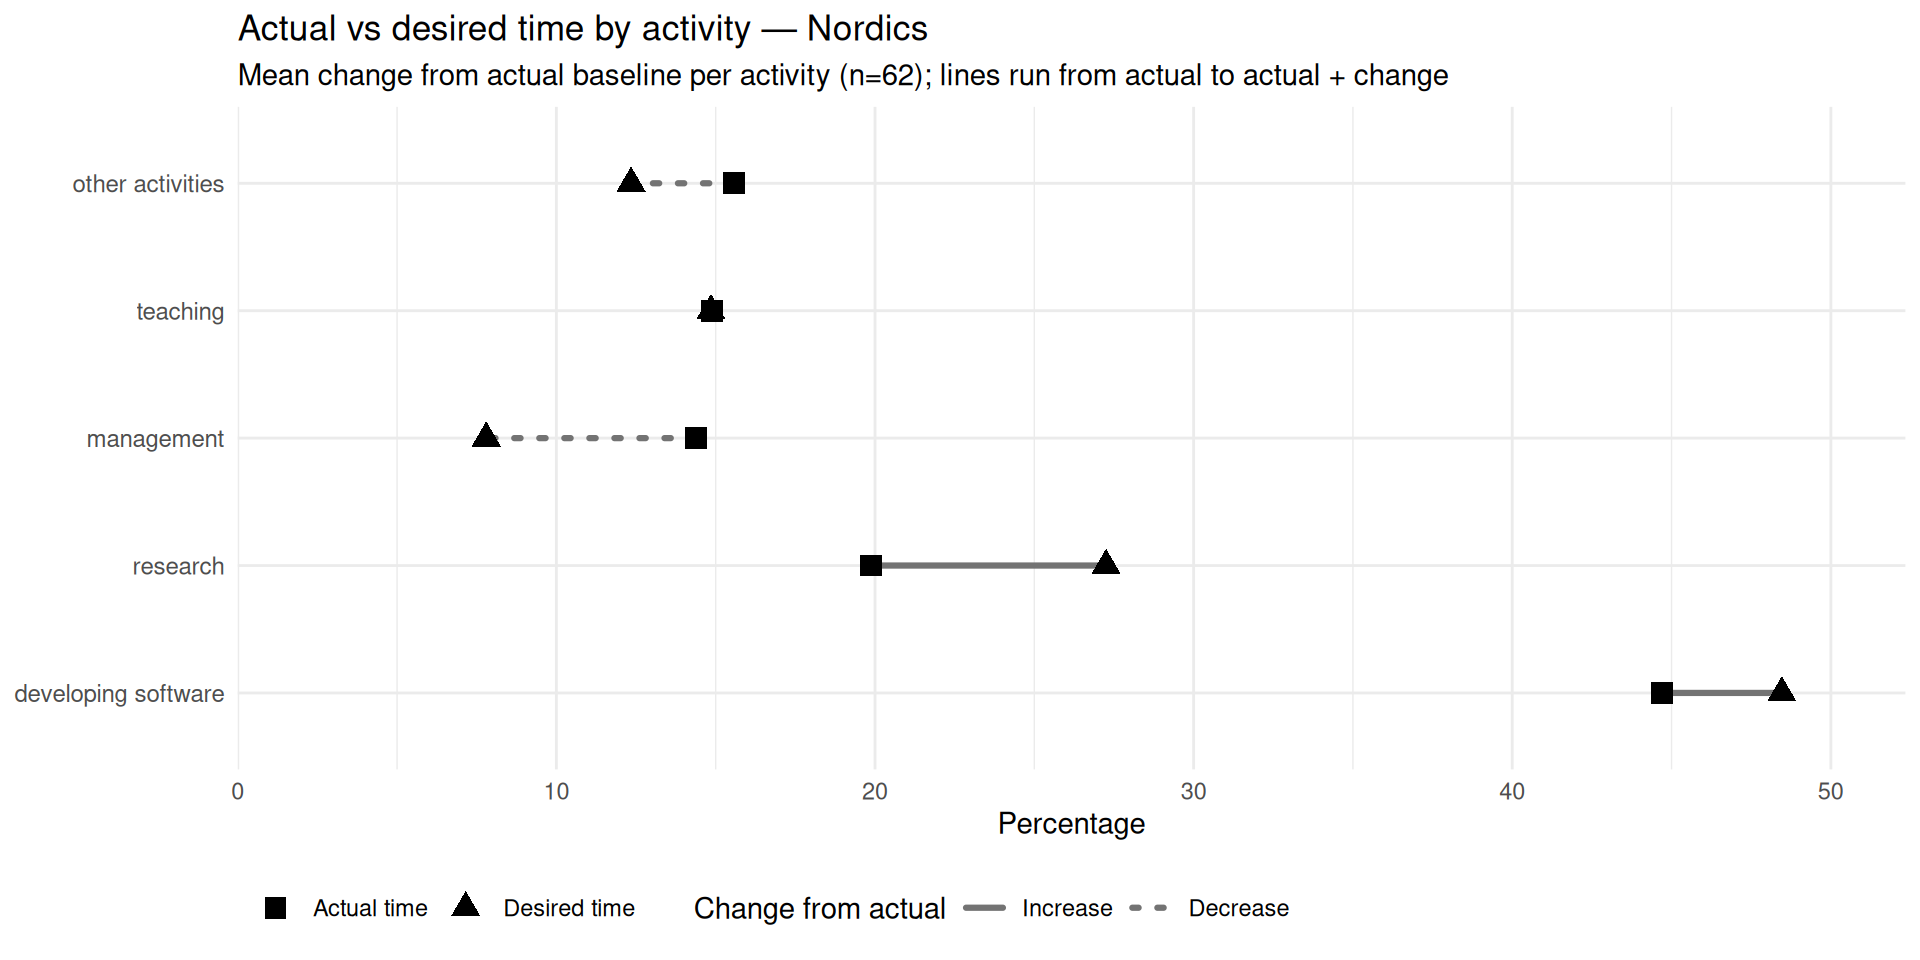
26.1.2 Statistics by age group
| Time allocation by age group (Nordics) | |||||||||||
| Mean percentages by activity within each age group | |||||||||||
Below 35
|
35-45
|
45+
|
|||||||||
|---|---|---|---|---|---|---|---|---|---|---|---|
| Activity | Actual (%) | Desired (%) | Desired - actual | Activity | Actual (%) | Desired (%) | Desired - actual | Activity | Actual (%) | Desired (%) | Desired - actual |
| developing software | 43.7 | 47.5 | 3.8 | developing software | 42.9 | 47.3 | 4.4 | developing software | 52.9 | 55.6 | 2.7 |
| research | 27.6 | 28.7 | 1.1 | research | 17.4 | 28.1 | 10.8 | research | 12.9 | 21.2 | 8.4 |
| management | 10.6 | 7.4 | −3.2 | management | 17.4 | 7.1 | −10.3 | management | 15.6 | 10.9 | −4.6 |
| teaching | 13.5 | 17.0 | 3.5 | teaching | 17.5 | 16.6 | −1.0 | teaching | 10.0 | 6.6 | −3.4 |
| other activities | 12.0 | 7.6 | −4.4 | other activities | 17.5 | 14.2 | −3.3 | other activities | 18.0 | 16.1 | −1.9 |
26.1.3 Participant allocation
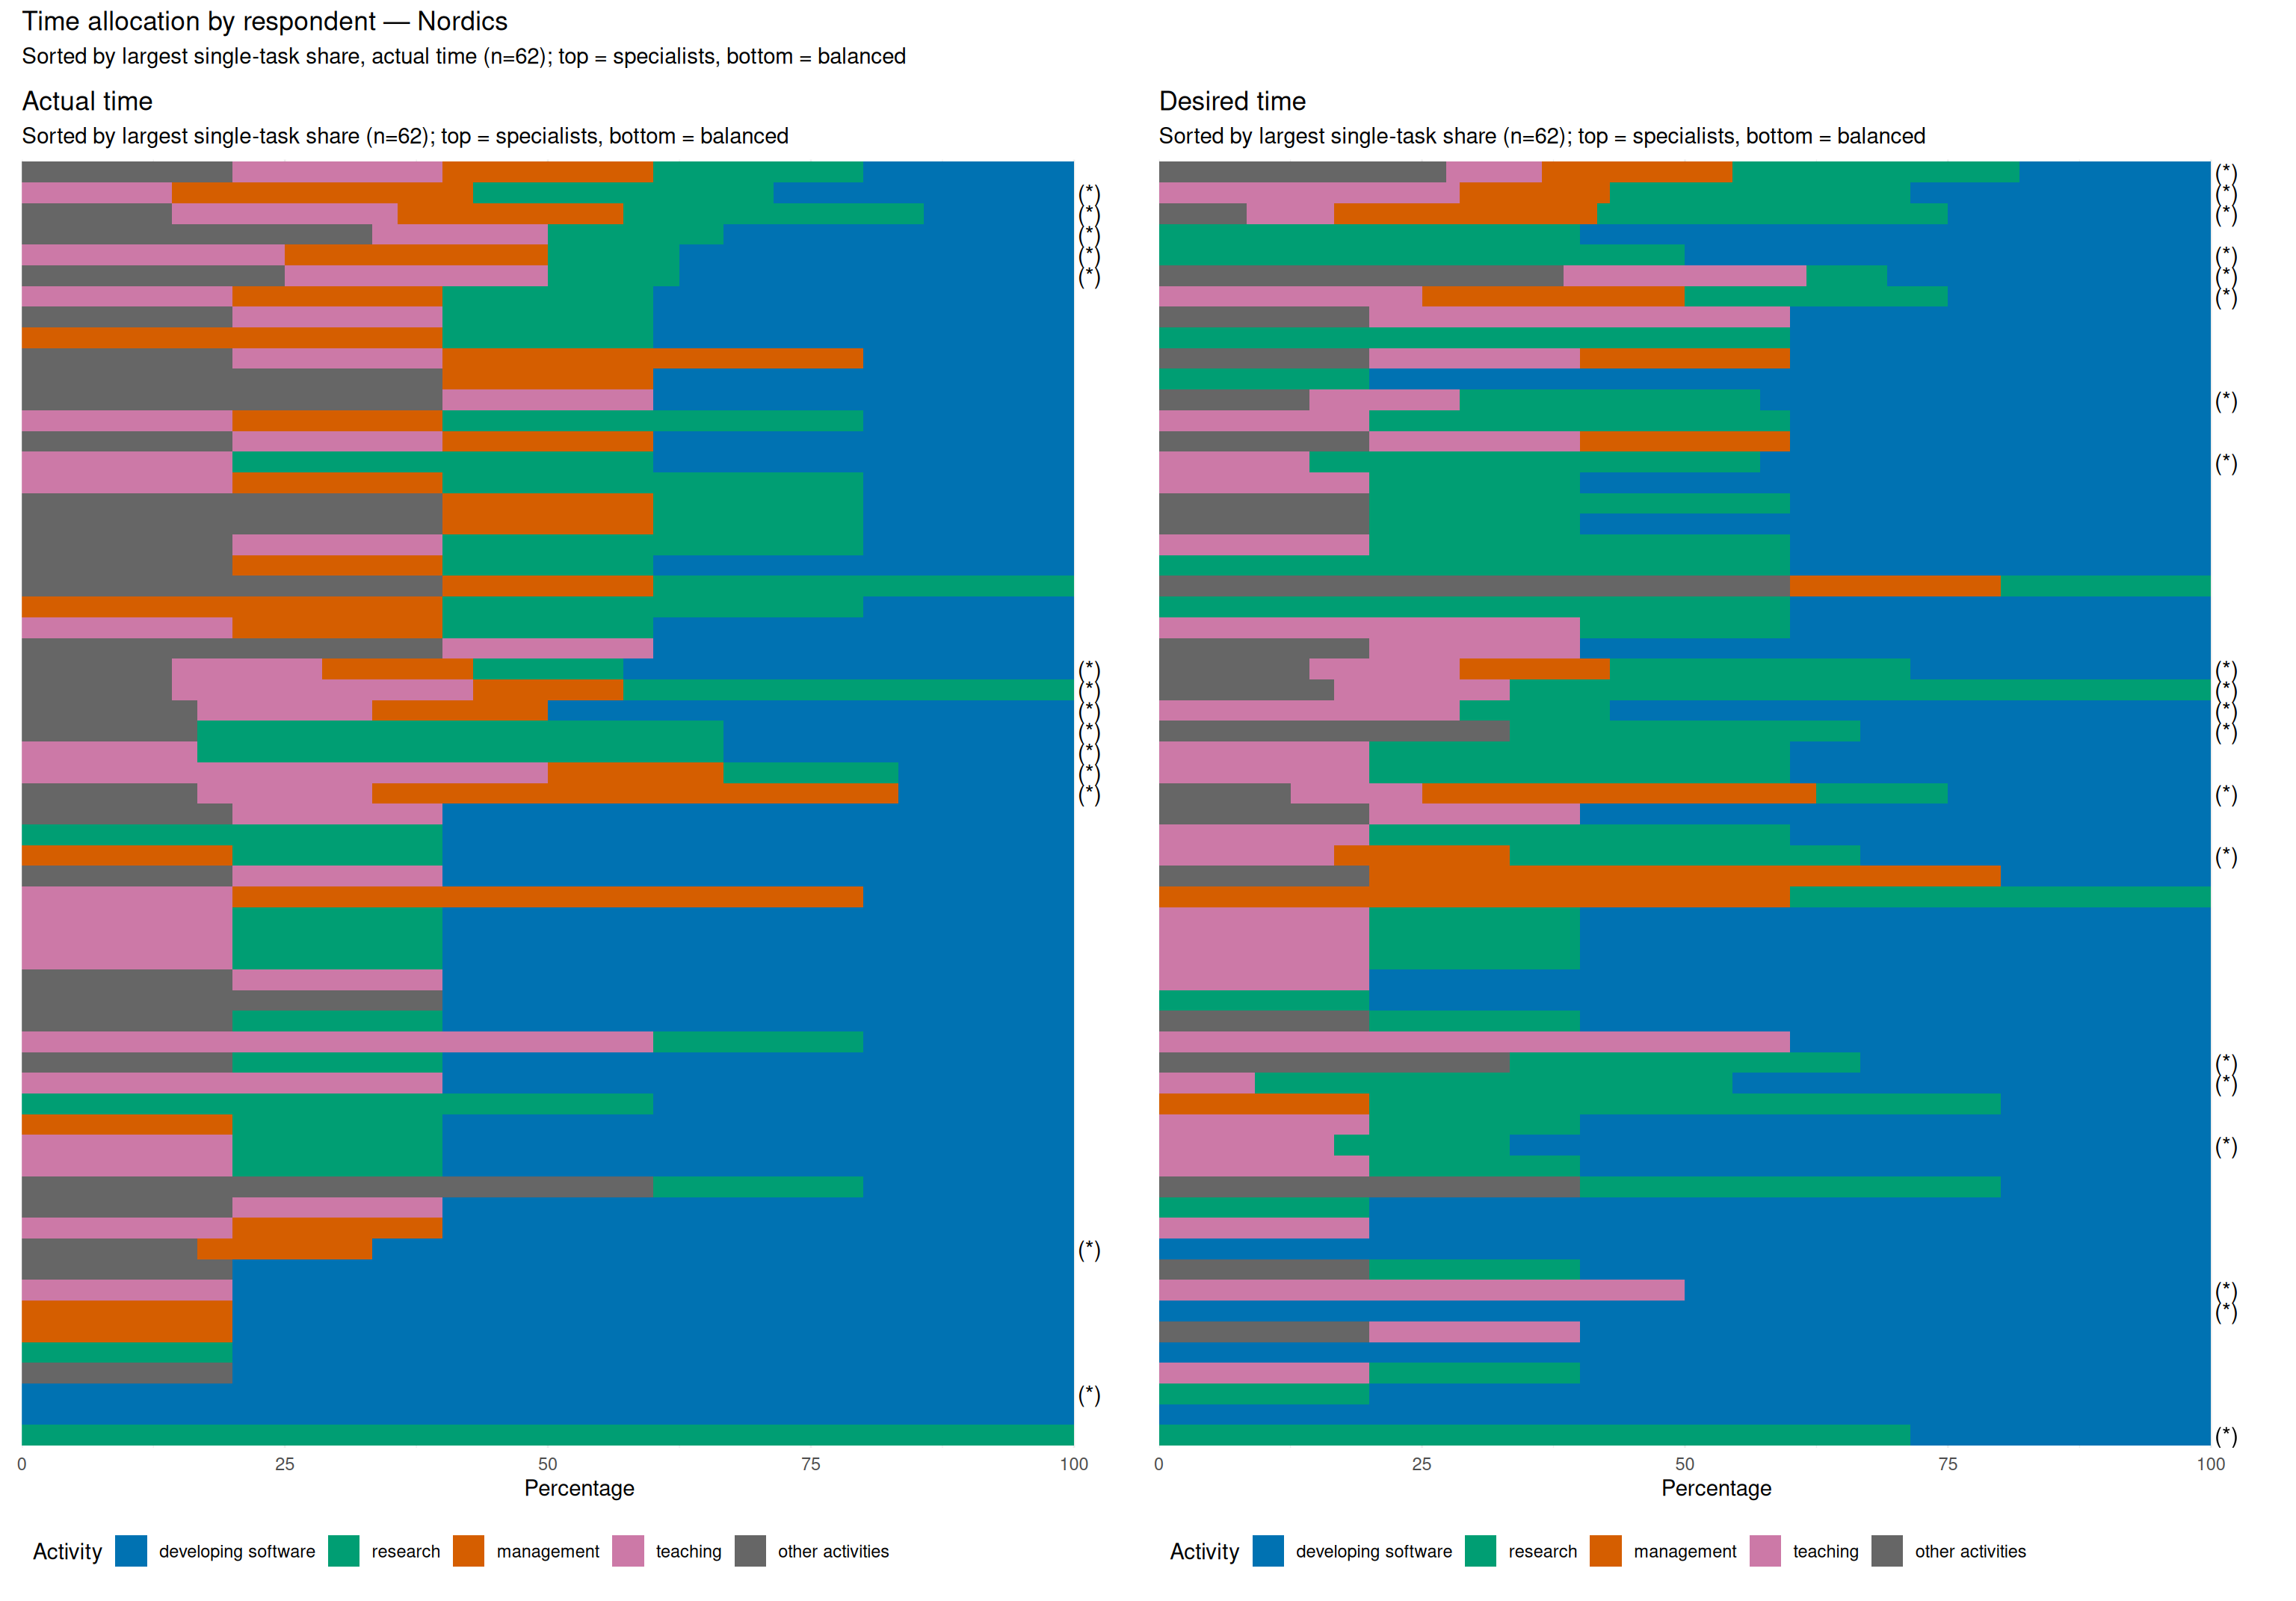
In the charts below, a bracketed asterisk (*) at the end of a bar marks respondents whose reported activity shares did not sum to 100%. For those individuals, each share was rescaled proportionally (multiplied by (100 / )) so the bar reaches 100% while preserving the relative split across tasks.
Each row is one respondent; bar segments show time shares per activity (rescaled to 100% where needed; see note above). Respondents are sorted by their largest single-task share in actual time (specialists at the top); the same row order is used for desired time.
26.2 Within Nordics
26.2.1 Descriptive Statistics
| Time allocation within Nordics | |||
| Mean percentages by activity and country | |||
| Activity | Actual (%) | Desired (%) | Desired - actual |
|---|---|---|---|
| Estonia | |||
| developing software | 29.8 | 37.0 | 7.2 |
| research | 32.5 | 43.0 | 10.5 |
| management | 13.6 | 7.5 | −6.1 |
| teaching | 17.6 | 15.9 | −1.7 |
| other activities | 11.9 | 9.4 | −2.5 |
| Iceland | |||
| developing software | 16.7 | 40.0 | 23.3 |
| research | 16.7 | 40.0 | 23.3 |
| teaching | 50.0 | 20.0 | −30.0 |
| Denmark | |||
| developing software | 40.0 | 61.7 | 21.7 |
| research | 25.0 | 19.2 | −5.8 |
| management | 20.0 | 0.0 | −20.0 |
| teaching | 13.3 | 12.2 | −1.1 |
| other activities | 30.0 | 20.0 | −10.0 |
| Sweden | |||
| developing software | 49.7 | 48.8 | −0.8 |
| research | 13.2 | 24.7 | 11.5 |
| management | 11.1 | 8.4 | −2.7 |
| teaching | 14.7 | 13.5 | −1.2 |
| other activities | 17.8 | 13.0 | −4.8 |
| Norway | |||
| developing software | 46.7 | 45.6 | −1.0 |
| research | 27.1 | 30.5 | 3.3 |
| management | 15.2 | 6.7 | −8.5 |
| teaching | 15.5 | 15.9 | 0.3 |
| other activities | 14.6 | 18.9 | 4.3 |
| Finland | |||
| developing software | 47.3 | 51.9 | 4.7 |
| research | 18.3 | 23.9 | 5.6 |
| management | 16.4 | 8.7 | −7.7 |
| teaching | 12.2 | 15.4 | 3.2 |
| other activities | 12.4 | 6.1 | −6.4 |
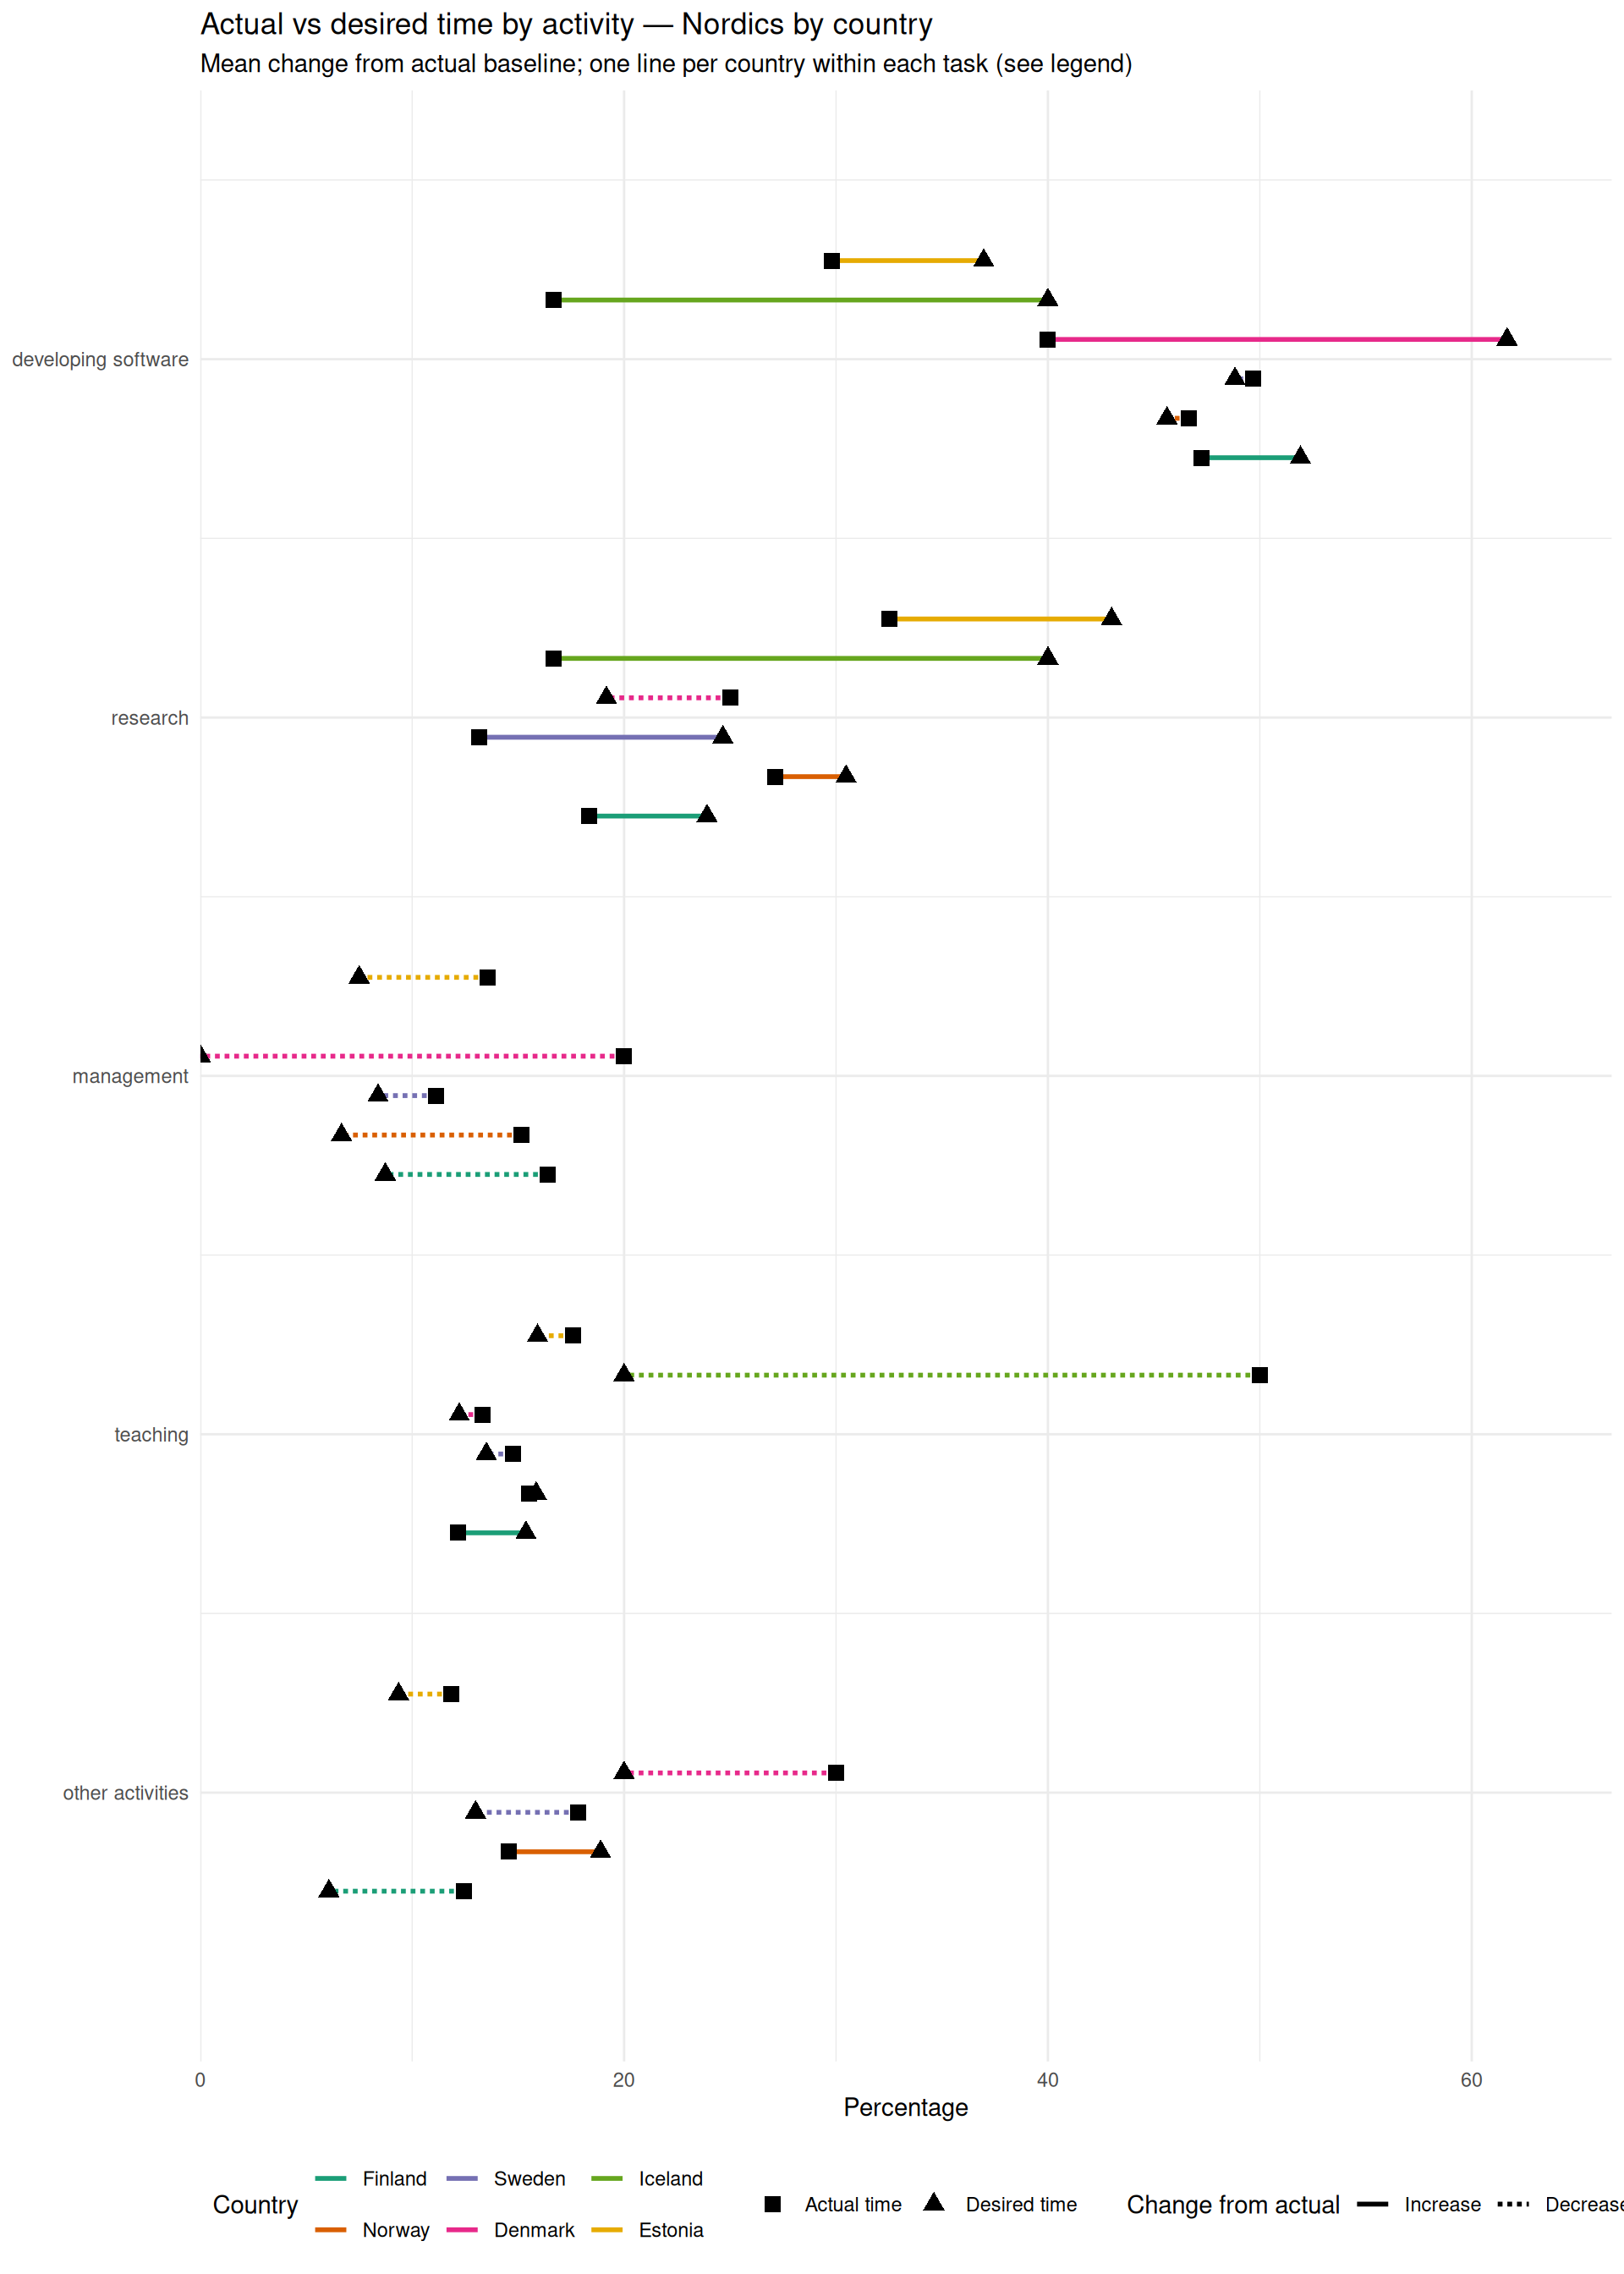
The same summary with one line per country within each activity (tasks on the y-axis):
26.3 Between Countries
26.3.1 Descriptive Statistics
| Time allocation by country groups | |||
| Mean percentages by activity and country group | |||
| Activity | Actual (%) | Desired (%) | Desired - actual |
|---|---|---|---|
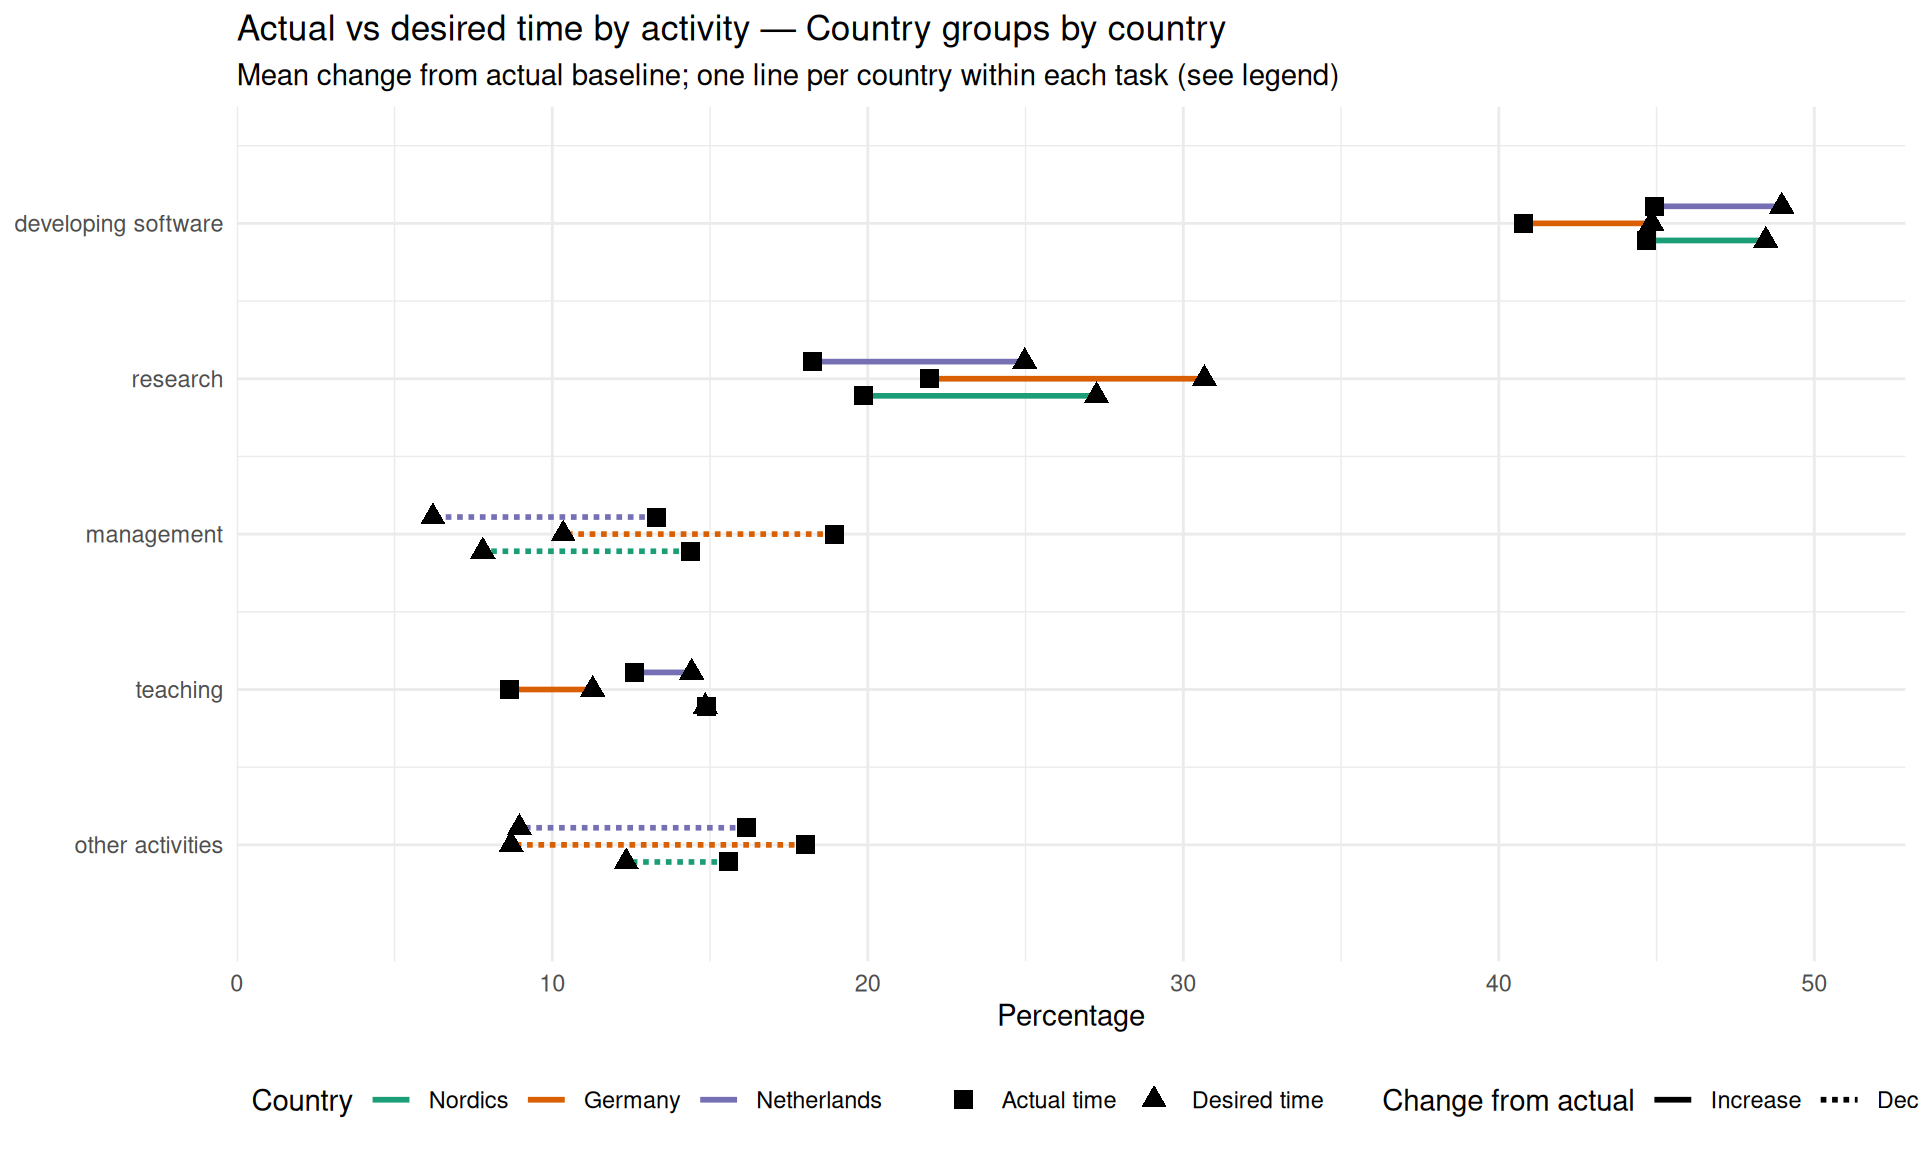
| Netherlands | |||
| developing software | 44.9 | 49.0 | 4.0 |
| research | 18.2 | 25.0 | 6.7 |
| management | 13.3 | 6.2 | −7.1 |
| teaching | 12.6 | 14.4 | 1.8 |
| other activities | 16.2 | 9.0 | −7.2 |
| Germany | |||
| developing software | 40.8 | 44.8 | 4.1 |
| research | 21.9 | 30.7 | 8.7 |
| management | 18.9 | 10.3 | −8.6 |
| teaching | 8.7 | 11.3 | 2.6 |
| other activities | 18.0 | 8.7 | −9.3 |
| Nordics | |||
| developing software | 44.7 | 48.5 | 3.8 |
| research | 19.9 | 27.3 | 7.4 |
| management | 14.4 | 7.8 | −6.6 |
| teaching | 14.9 | 14.9 | 0.0 |
| other activities | 15.6 | 12.3 | −3.2 |